

In the dynamic world of trading, understanding the underlying market activity is crucial for success. Volume indicators are powerful tools that can provide valuable insights into the market’s pulse, helping traders make informed decisions. By analyzing the trading volume, these indicators offer a glimpse into the strength or weakness of price movements. For traders seeking to enhance their market analysis, volume indicators are indispensable. In this article, we will explore how these indicators can be seamlessly integrated into trading strategies to improve overall market analysis.
Understanding the Importance of Volume Indicators

Volume indicators play a vital role in market analysis. They allow traders to assess the level of activity behind price movements. Unlike price indicators, which only show price trends, volume indicators reveal the market’s commitment to those trends. High volume often signals strong market sentiment, while low volume can indicate uncertainty or a lack of interest.
One of the primary advantages of using volume indicators is their ability to confirm trends. For instance, if the price of an asset is rising, but the volume is decreasing, it could be a sign that the trend is weakening. Conversely, rising volume during a price increase suggests strong market support, making the trend more likely to continue.
Best Volume Indicators in Trading
When it comes to volume indicators, several stand out for their reliability and effectiveness in market analysis. These include On-Balance Volume (OBV), Money Flow Index (MFI), Accumulation/Distribution (A/D), Volume-Weighted Average Price (VWAP), and the Chaikin Oscillator. Each of these indicators offers unique insights into market dynamics.
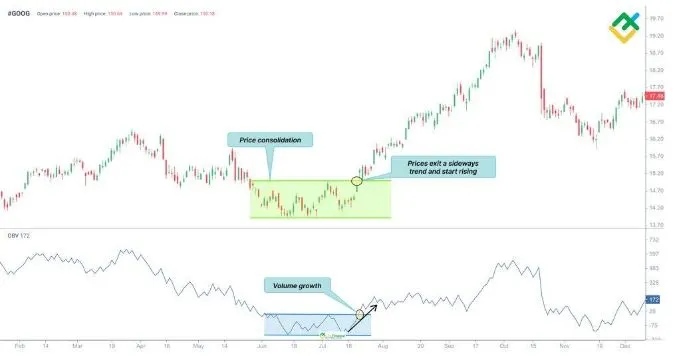
On-Balance Volume (OBV) is one of the most popular volume indicators. It measures the cumulative buying and selling pressure by adding or subtracting volume based on price movement. A rising OBV indicates that buying pressure is increasing, which can precede a price increase. On the other hand, a falling OBV suggests increasing selling pressure, which could signal a potential price drop.
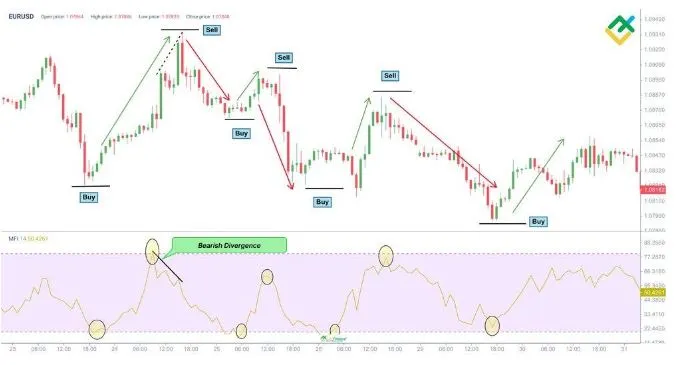
The Money Flow Index (MFI) is another valuable volume indicator. Similar to the Relative Strength Index (RSI), the MFI incorporates both price and volume data. It ranges from 0 to 100, with readings above 80 indicating overbought conditions and below 20 suggesting oversold conditions. The MFI is particularly useful for identifying divergences between price and volume, which can signal potential reversals.
Volume Analysis Concepts

Volume analysis is a cornerstone of effective trading strategies. It provides traders with a deeper understanding of the market’s behavior and potential future movements. By analyzing volume patterns, traders can identify key support and resistance levels, detect trend reversals, and confirm the strength of ongoing trends.
Incorporating volume analysis into your trading strategy can help you spot profitable opportunities. For example, if you notice a sudden spike in volume at a key support level, it may indicate that large players are entering the market. This could be a signal to buy. Conversely, a sharp increase in volume at a resistance level might suggest that it’s time to sell.
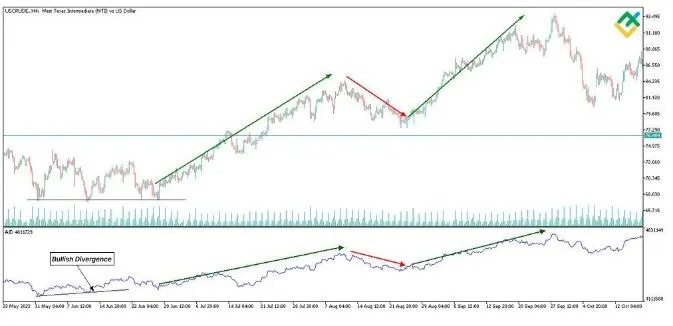
Accumulation/Distribution (A/D) is a volume indicator that combines price and volume to assess the strength of a trend. It helps traders determine whether the market is being accumulated (bought) or distributed (sold). A rising A/D line indicates accumulation, while a falling line suggests distribution. This indicator can be particularly useful in spotting divergences between the A/D line and the price, signaling potential reversals.
Applying Volume Indicators in Trading
To effectively use volume indicators in your trading strategies, it’s important to understand how they work and how they can be applied to different market conditions. Volume indicators are best used in conjunction with other technical analysis tools to confirm signals and enhance the accuracy of your predictions.
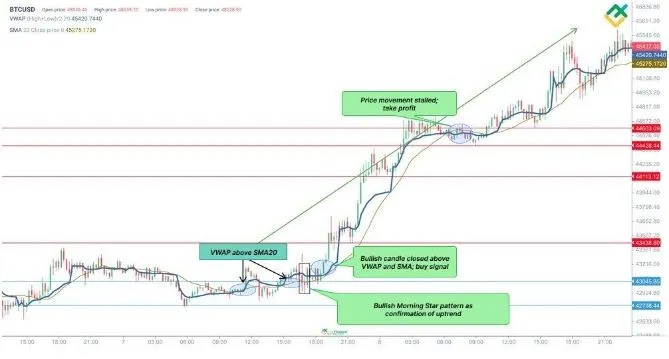
One common approach is to use Volume-Weighted Average Price (VWAP) as a dynamic support or resistance level. VWAP represents the average price of an asset over a specific period, weighted by volume. When the price is above the VWAP, it indicates a bullish trend, while a price below the VWAP suggests a bearish trend. Traders often use VWAP to identify potential entry and exit points in their trades.
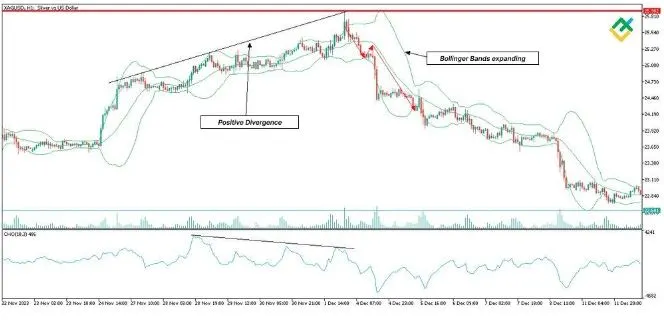
Another powerful tool is the Chaikin Oscillator. This indicator calculates the difference between a short-term and long-term moving average of the Accumulation/Distribution line. The Chaikin Oscillator can help traders identify trends and potential reversal points by analyzing the momentum of money flow into or out of an asset. A positive divergence between the Chaikin Oscillator and the price can signal a buying opportunity, while a negative divergence may indicate a selling opportunity.
Using Volume Analysis to Confirm Trends

Volume analysis is particularly useful for confirming trends in the market. When the price of an asset is moving in a certain direction, the volume should ideally move in the same direction. If the volume is increasing, it suggests that the trend is gaining momentum and is likely to continue. However, if the volume is decreasing, it may indicate that the trend is losing strength and a reversal could be imminent.
For example, if you are analyzing a stock that is in an uptrend, you should pay attention to the volume. If the volume is increasing along with the price, it confirms that the uptrend is strong. However, if the volume starts to decrease while the price is still rising, it could be a sign that the uptrend is weakening, and a reversal might be on the horizon.
On-Balance Volume (OBV) is particularly effective in confirming trends. If the OBV is rising along with the price, it confirms that the uptrend is supported by strong buying pressure. Conversely, if the OBV is falling while the price is rising, it suggests that the uptrend may not be sustainable, and a reversal could be coming.
Volume Indicators and Support/Resistance Levels
Volume indicators can also be extremely useful in identifying support and resistance levels. These levels are critical in trading as they represent areas where the price tends to stop and reverse. By analyzing volume at these levels, traders can gain insights into the strength of the support or resistance.
For instance, if the price approaches a support level with low volume, it may indicate that the level will hold, and the price is likely to bounce back. However, if the price approaches the support level with high volume, it could suggest that the level will be broken, and the price may continue to fall.
Similarly, if the price reaches a resistance level with low volume, it may indicate that the level will hold, and the price is likely to reverse. But if the price reaches the resistance level with high volume, it could suggest that the level will be broken, and the price may continue to rise.
Money Flow Index (MFI) is particularly useful in this context. When the MFI reaches overbought or oversold levels, it can signal that the price is approaching a key support or resistance level. By combining the MFI with other volume indicators, traders can make more informed decisions about when to enter or exit a trade.
Combining Volume Indicators with Other Tools
While volume indicators are powerful on their own, they are even more effective when combined with other technical analysis tools. For example, you can use volume indicators in conjunction with moving averages, candlestick patterns, or trend lines to enhance your market analysis.
One popular strategy is to use the Chaikin Oscillator alongside the Relative Strength Index (RSI) or Stochastic Oscillator. The Chaikin Oscillator can confirm the strength of a trend identified by the RSI or Stochastic, providing a more comprehensive view of the market. Similarly, you can use the VWAP indicator with moving averages to identify potential entry and exit points based on the average price and volume dynamics.
When combining volume indicators with other tools, it’s important to ensure that they complement each other. This means using indicators that provide different types of information, such as price trends, volume, and momentum. By doing so, you can reduce the risk of false signals and improve the accuracy of your trades.
Summary
Volume indicators are essential tools for any trader looking to improve their market analysis. They provide valuable insights into the strength and sustainability of price trends, helping traders make more informed decisions. Whether you’re using On-Balance Volume (OBV), Money Flow Index (MFI), Accumulation/Distribution (A/D), Volume-Weighted Average Price (VWAP), or the Chaikin Oscillator, these indicators can enhance your trading strategies and increase your chances of success.
By incorporating volume analysis into your trading strategy, you can better understand market dynamics, identify key support and resistance levels, and confirm the strength of trends. Remember to combine volume indicators with other technical analysis tools to create a well-rounded approach to market analysis.
In today’s fast-paced trading environment, staying ahead of the curve is crucial. By mastering the use of volume indicators, you can gain a competitive edge and improve your trading outcomes. Start integrating these powerful tools into your strategy today, and transform your market analysis for better results.
Click here to read our latest article Controversial Trading: Surprising Truths to Challenge Your Strategy