
In the dynamic world of trading, identifying trend reversal points is crucial for timing the market effectively. Recognizing these points helps traders maximize profits and minimize risks. This article delves into the significance of trend reversal points, providing a strategic approach to detecting shifts in market movement.
The Basics of Trend Reversal Points

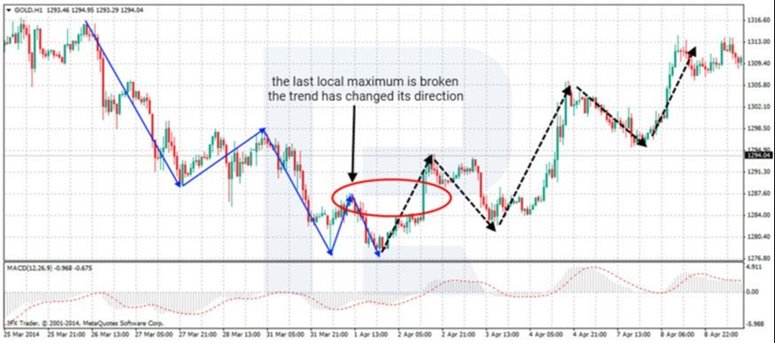
Trend reversal points signal a potential change in the direction of market movement, indicating that the prevailing trend may be losing momentum. Detecting these points involves analyzing trendline breakaways and market movements, two critical indicators that can foretell shifts in market dynamics. By understanding where these reversal points occur, traders can adjust their strategies, securing positions that align with the new trend direction.
To effectively harness trend reversal points, traders must first grasp the concept of a trendline. A trendline connects significant lows in an uptrend and highs in a downtrend. When prices break through these lines, it often signals a shift. Traders closely monitor these breakaways, using them to forecast potential trend reversals.
Furthermore, volume plays a pivotal role in confirming breakaways. An increase in volume at the point of a trendline breakaway strengthens the signal of a potential reversal. Traders combine this information with other indicators to make informed decisions.
Additionally, traders consider the duration of the trend before a breakaway. Long-established trends that break suddenly are particularly noteworthy. Such breaks may suggest a significant shift in market sentiment, urging a strategic review of trading positions.
Advanced Analysis Techniques
Beyond basic trendline analysis, advanced techniques like moving averages and momentum oscillators can pinpoint trend reversal points more precisely. These tools help traders discern whether a movement is just a temporary correction or a true reversal.
Moving averages smooth out price data, providing a clearer view of the trend direction. A crossover of short-term and long-term moving averages can indicate a trend reversal. This method reduces the risk of misinterpreting short-term fluctuations as reversals.
Momentum oscillators, such as the Relative Strength Index (RSI), offer insights into the strength of a trend. An RSI reading above 70 suggests an overbought condition, while below 30 indicates oversold. These extremes can precede a reversal, providing a preemptive signal to traders.
Moreover, candlestick patterns also serve as valuable tools in identifying trend reversal points. Patterns like the ‘Doji’ or ‘Hammer’ can signify market indecision or a change in momentum. When these patterns align with other indicators, the signal for a trend reversal strengthens.
Integrating Market Movements
Traders also need to pay close attention to overall market movements. Macro-economic indicators, news events, and market sentiment can all influence trend dynamics. By integrating these factors, traders can better anticipate and react to potential reversal points.
For instance, a sudden economic announcement that diverges from market expectations can trigger rapid trend reversals. Traders who stay updated and react swiftly often manage to capitalize on these shifts.
Finally, continuous education and practice are crucial. Successful traders constantly refine their strategies, adapting to new information and market conditions. They also review their trades to learn from successes and mistakes.
In conclusion, mastering trend reversal points involves a combination of technical analysis, understanding market psychology, and continuous learning. By employing a comprehensive approach, traders can enhance their ability to identify and react to trend reversals, ultimately leading to more effective trading strategies.
The Role of Trendline Breakaway
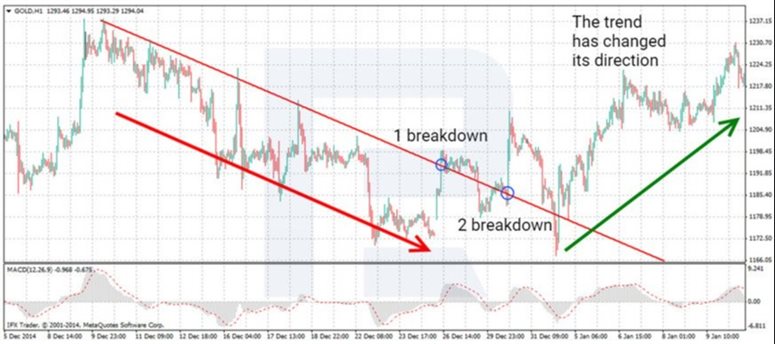
A trendline breakaway occurs when the price of an asset moves through and closes beyond a defined trendline, suggesting a significant shift. This breakaway is often the first clue that a trend might be reversing. Traders should watch for multiple breakaways to confirm that a genuine reversal is underway, rather than a temporary fluctuation. This confirmation helps traders avoid premature decisions based on false signals.
Understanding the significance of a trendline breakaway requires familiarity with trendline construction. Traders draw trendlines by connecting the lowest lows in an uptrend and the highest highs in a downtrend. A valid breakaway not only crosses these lines but also closes beyond them, signaling a potential reversal of the current trend.
To enhance the reliability of a trendline breakaway, traders also consider the trading volume during the break. A high trading volume associated with the breakaway lends credence to the potential reversal. Conversely, a break on low volume might only represent a minor correction within a continuing trend.
Moreover, the context in which a breakaway occurs greatly affects its significance. A trendline break that coincides with significant market events or economic announcements can indicate more robust and lasting reversals. Traders analyze these contexts to better predict the impact of a breakaway.
Delving Deeper: Technical Indicators and Trendline Breakaways
Beyond observing the breakaway itself, traders often employ additional technical indicators to verify a trend reversal. Indicators such as moving averages, Bollinger Bands, and MACD (Moving Average Convergence Divergence) provide further insights. For example, if a trendline breakaway coincides with a moving average crossover, it strengthens the signal of a potential reversal.
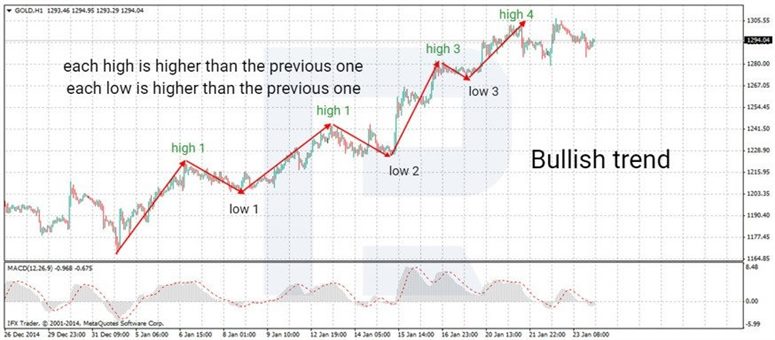
Traders also watch for patterns of higher highs and higher lows in uptrends or lower highs and lower lows in downtrends following a breakaway. These patterns help confirm the new trend direction and offer traders opportunities to enter or exit trades.
Another aspect to consider is the price action following the breakaway. A strong, swift move away from the trendline can be a stronger indicator of a true reversal. In contrast, hesitant or volatile price movements post-breakaway might suggest the market is still undecided.
Strategic Responses to Trendline Breakaways
Upon identifying a trendline breakaway, the trader’s response should be strategic and measured. Implementing stop-loss orders near the trendline can protect against losses if the breakaway turns out to be false. Similarly, setting profit targets based on the new trend direction can maximize potential gains.
Furthermore, experienced traders often use a staged approach to entering trades after a trendline breakaway. They might enter a partial position early, then add to the position as further confirmation of the reversal is established through additional technical indicators or price patterns.
In summary, a trendline breakaway is a powerful tool in a trader’s arsenal for spotting potential trend reversals. By combining careful analysis of breakaways with other technical indicators and strategic trade management, traders can enhance their ability to capitalize on these significant market movements.
Analyzing Market Movement

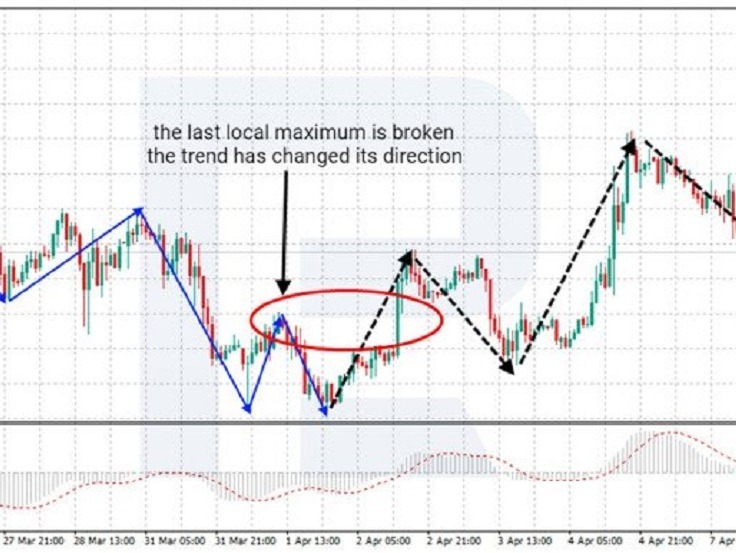
Market movement is another vital aspect to consider when looking for trend reversal points. A thorough analysis of market movement includes observing highs and lows within a trend. In bullish trends, the focus is on increasing highs and lows, while bearish trends emphasize decreasing ones. Any deviation from these patterns can indicate a potential reversal, urging traders to reevaluate their current positions.
To effectively analyze market movement, traders must first understand the typical patterns associated with bullish and bearish trends. In a bullish market, the price should consistently achieve higher highs and higher lows. This upward trend signifies strong buyer interest and a general market optimism. Conversely, in a bearish market, the presence of lower highs and lower lows suggests growing pessimism and a dominance of sellers.
Moreover, the analysis of market movement extends beyond just watching the trends. Traders integrate various technical tools such as Fibonacci retracements, pivot points, and support and resistance levels. These tools help in identifying potential areas where the market could experience reversals. For instance, a reversal might be more likely at a key Fibonacci level after a prolonged trend.
Additionally, the analysis includes monitoring the speed and volume of price changes. Sharp movements in price accompanied by high volumes can indicate a stronger, more significant reversal. Alternatively, slow movements on low volume might suggest that the market is less committed to the current trend direction.
Deeper Insights into Market Dynamics
The role of psychological factors in market movements cannot be understated. Psychological price points, like round numbers or historic highs and lows, often serve as key levels for trend reversals. Traders pay close attention to these areas, as they can trigger emotional responses from the market participants, leading to significant buying or selling pressures.
Chart patterns also play a crucial role in analyzing market movement. Patterns such as head and shoulders, double tops and bottoms, and triangles often precede trend reversals. Recognizing these patterns early helps traders anticipate potential changes in market direction.
Moreover, the use of moving averages helps smooth out price data to better identify the trend direction. A crossover of short-term and long-term moving averages might signal a reversal, making it a valuable tool for confirming other reversal indicators.
Applying Advanced Analysis Techniques
For traders looking to capitalize on trend reversals, combining multiple analysis techniques offers a more robust approach. Employing both technical analysis and fundamental analysis provides a comprehensive view of market conditions. For instance, a technical signal for a trend reversal that coincides with significant economic news can provide a stronger conviction for the trade.
Successful traders also keep an eye on market sentiment indicators like the put/call ratio or the VIX, which measure the level of fear or complacency in the market. A sudden shift in these indicators can signal a change in market dynamics, often preceding a trend reversal.
In conclusion, a detailed analysis of market movement is essential for identifying trend reversal points. By combining technical tools, understanding psychological factors, and keeping abreast of market sentiment, traders can enhance their ability to spot and capitalize on these critical trading opportunities. These strategies, when applied diligently, pave the way for informed and successful trading decisions.
Developing a Robust Trading Strategy
Incorporating the knowledge of trend reversal points into your trading strategy is essential for long-term success. A well-thought-out trading strategy considers both bullish and bearish trends, adapting to changes as they occur. Traders should integrate risk management techniques and decide on entry and exit points based on confirmed reversal signals. This strategic planning ensures that decisions are not only reactive but also proactive.
A robust trading strategy starts with clear goals and a solid understanding of one’s risk tolerance. This foundation allows traders to align their tactics with their financial and psychological comfort levels. For instance, more conservative traders might prefer strategies that emphasize capital preservation, utilizing tight stop-loss orders to manage risks. In contrast, more aggressive traders might pursue higher returns by taking on greater risks, possibly using leverage to maximize their potential gains.
Moreover, setting clear entry and exit points is crucial. Traders use trend reversal points to determine these points. A disciplined approach to these decisions can significantly enhance trading effectiveness. Entry points should be chosen based on strong reversal signals, while exit points should be set to protect gains or limit losses if the market moves unfavorably.
Enhancing Strategy with Technical Analysis
Technical analysis tools are invaluable in developing a trading strategy around trend reversal points. Indicators such as moving averages, RSI, and MACD provide insights into market momentum and potential reversal points. By combining these tools, traders can more accurately time their entries and exits, increasing the likelihood of successful trades.
Additionally, traders often use backtesting to refine their strategies. This involves applying trading rules to historical data to evaluate their effectiveness. Backtesting helps identify strengths and weaknesses in a strategy, allowing traders to make informed adjustments before risking real money.
Chart patterns also play a crucial role in strategy development. Patterns like flags, pennants, and wedges can indicate continuations or reversals. Recognizing these patterns as they form helps traders anticipate future price movements and position themselves accordingly.
Implementing Dynamic Risk Management
Dynamic risk management is integral to a robust trading strategy. This involves adjusting exposure based on market conditions and individual trade performance. For example, if a trade moves favorably, a trader might increase their position size or move their stop-loss order to lock in profits. Conversely, if the market conditions deteriorate or an anticipated trend reversal fails to materialize, reducing exposure or tightening stop-losses can help mitigate losses.
Moreover, the use of risk-reward ratios helps traders manage their trades more effectively. A common strategy is to seek a minimum risk-reward ratio of 1:3, meaning the potential profit should be at least three times the potential loss. This ratio ensures that even if only a third of the trades are successful, the trader can still remain profitable.
In conclusion, developing a robust trading strategy that incorporates trend reversal points requires a blend of technical analysis, clear goal setting, disciplined risk management, and continuous learning. By staying informed and adaptable, traders can optimize their strategies to navigate the complexities of the market successfully. These efforts culminate in a trading approach that is not just reactive to market changes but also proactive in capitalizing on opportunities as they arise.
Bullish and Bearish Trends: What Traders Need to Know

Understanding bullish and bearish trends is fundamental in trading. Bullish trends are characterized by rising prices, while bearish trends are marked by falling prices. Recognizing these trends allows traders to anticipate market movements and identify trend reversal points effectively. Each trend offers different challenges and opportunities, demanding tailored strategies to navigate them successfully.
In a bullish market, optimism prevails as investors expect prices to continue rising. This trend typically occurs during periods of economic strength or when significant positive developments impact investor sentiment. To capitalize on bullish trends, traders often look for signs of sustained growth such as increased trading volume and positive news that could drive prices higher. Entry points might be identified following minor pullbacks within the overall upward trend, providing an opportunity to benefit from the continuation of the rise.
Conversely, bearish trends reflect negative sentiment, with falling prices indicating investor caution or pessimism. These trends can be triggered by adverse economic indicators, geopolitical instability, or sector-specific setbacks. In bearish markets, traders might adopt short-selling strategies, where they profit from declining stock prices. Identifying early signs of bearish reversals when a bullish trend starts to lose momentum can allow traders to exit long positions or enter short ones before the market dips.
Adapting to Market Dynamics
Traders must adapt their strategies based on the prevailing market trend to remain effective. In bullish markets, maintaining long positions and using stop-loss orders to protect gains can be advantageous. Traders should monitor indicators such as moving averages and MACD to confirm that the bullish trend continues. On the other hand, during bearish trends, increasing the use of protective puts or considering inverse ETFs might be wise to hedge against downturns.
Furthermore, understanding the drivers behind bullish and bearish trends is crucial. Economic data releases, earnings reports, and central bank announcements can all significantly impact market direction. Traders must stay informed about such events to adjust their strategies accordingly.
Technical analysis also plays a critical role in navigating both bullish and bearish markets. Tools like Fibonacci retracement levels can help identify potential support in a bullish trend or resistance in a bearish trend, informing decisions on entry and exit points. Additionally, candlestick patterns can provide insights into market sentiment, offering clues about potential reversals or continuations of the trend.
Leveraging Trends for Strategic Advantage
Successful traders not only recognize trends but also understand the importance of timing in their trading decisions. They analyze the length and strength of trends to optimize their trading strategies. For example, long-term trends may offer more security but require patience and a larger capital outlay, while short-term trends can provide quick profits but involve more risk.
Market volatility should not be overlooked, as it can significantly affect trend stability. High volatility may indicate that a trend is about to end, prompting traders to adjust their positions to mitigate risk. Conversely, low volatility might suggest that the current trend is stable, providing a safer environment for following the trend.
In conclusion, by effectively understanding and leveraging bullish and bearish trends, traders can enhance their ability to make informed decisions. Tailoring strategies to fit the specific characteristics of each trend ensures that traders can not only survive but thrive in the ever-changing market landscape.
The Importance of Continual Learning
To master the identification of trend reversal points, continual learning and adaptation are necessary. Markets evolve, and so should your trading strategies. Staying informed about market conditions and learning from past trades are pivotal in refining your approach. Additionally, leveraging advanced analytical tools can enhance your ability to spot trend reversals earlier and more accurately.
Conclusion: Mastery of Trend Reversal Points Leads to Enhanced Market Performance
Mastering the identification of trend reversal points is vital for any trader aiming to succeed in the financial markets. By understanding the nuances of trendline breakaway and market movement, and developing a versatile trading strategy that accommodates both bullish and bearish trends, traders can enhance their market performance significantly. Embrace these insights, and watch your trading skills reach new heights.
Click here to read our latest article on Insights From Melinda Gates