

In the world of trading, staying ahead of the curve requires using tools that can identify market trends and momentum. The Moving Average Convergence Divergence, commonly known as MACD, is one such tool. As a technical indicator, It plays a crucial role in helping traders make informed decisions. Whether you’re a seasoned trader or just starting, understanding the indicator can significantly enhance your trading strategy. This article delves into how the indicator works, its importance in trend following, and how it can be a game-changer in momentum trading.
What is MACD?

It is a technical indicator that combines moving averages to provide insight into price momentum. Developed by Gerald Appel in the late 1970s, it helps traders identify potential buy and sell signals. It consists of three main components: the MACD line, the signal line, and the histogram. The MACD line represents the difference between the 12-day and 26-day Exponential Moving Averages (EMAs). The signal line is a 9-day EMA of the MACD line. The histogram visually shows the difference between the MACD line and the signal line.
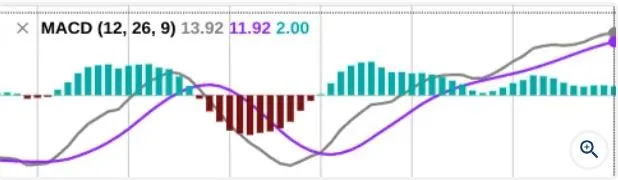
FOCUSING ON MACD. The MACD (depicted by the gray line) represents the difference between two exponential moving averages (EMAs): the 12-period and the 26-period. The purple line, known as the signal line, is a 9-period moving average of the MACD itself. The gray line, which moves faster, gives greater emphasis to more recent prices, while the purple signal line smooths these movements by averaging them over nine periods. Notice how the histogram bars expand as the two lines move further apart—this is directly related. This example is for demonstration purposes only
By comparing two moving averages, traders can gain insight into the momentum behind price trends. When the MACD line crosses above the signal line, it indicates bullish momentum. Conversely, when the MACD line crosses below the signal line, it signals bearish momentum. The histogram helps traders visualize these crossovers, making it easier to spot potential trading opportunities.
How MACD Enhances Trend Following
Trend following is a popular trading strategy that aims to capitalize on market momentum. Traders who follow trends seek to enter the market when a trend is established and exit before it reverses. It plays a pivotal role in this strategy by providing clear signals of trend momentum. When the MACD line crosses the signal line from below, it suggests that an upward trend might be starting. This signal can prompt traders to enter a long position.
On the other hand, when the MACD line crosses the signal line from above, it may indicate that a downward trend is beginning. Traders can use this signal to consider short positions. The ability to identify these crossover points allows traders to align their trades with the prevailing market trend, enhancing the effectiveness of their trend-following strategy.
Moreover, the indicator can be used in various time frames, making it versatile for different trading styles. Whether you’re a day trader looking for short-term trends or a swing trader aiming to capture medium-term trends, It can be tailored to suit your needs.
Understanding Momentum Trading with MACD

Momentum trading involves capitalizing on the strength of a trend by entering positions that align with the direction of momentum. It is particularly effective in momentum trading because it highlights the acceleration or deceleration of price movements. When the MACD line is rising above the signal line, it suggests that bullish momentum is increasing. This can be an opportune moment for traders to enter a long position and ride the wave of upward momentum.
Conversely, when the MACD line is falling below the signal line, it indicates that bearish momentum is gaining strength. Traders can use this signal to enter a short position, capitalizing on the downward momentum. The histogram further enhances momentum trading by showing the distance between the MACD line and the signal line. Larger bars on the histogram suggest stronger momentum, while smaller bars indicate weakening momentum.
By focusing on momentum, traders can enter positions with the wind at their back, increasing the likelihood of a successful trade. It helps traders identify these moments of momentum with precision, making it a valuable tool for those looking to capitalize on short-term price movements.
The Importance of the Signal Line
The signal line is a critical component of the indicator. It acts as a trigger point for buy and sell signals. As a moving average of the MACD line, the signal line smooths out the data, making it easier to identify changes in momentum. When the MACD line crosses above the signal line, it generates a bullish signal. This crossover suggests that the faster-moving average (represented by the MACD line) is gaining strength relative to the slower-moving average (represented by the signal line).
Conversely, when the MACD line crosses below the signal line, it produces a bearish signal. This indicates that the slower-moving average is overtaking the faster-moving average, suggesting a potential downtrend. Traders often use these crossovers as entry or exit points for their trades. The signal line’s importance lies in its ability to confirm the direction of the trend and provide a clear signal for action.
In addition to crossovers, the distance between the MACD line and the signal line can also provide valuable information. When the MACD line is significantly above the signal line, it suggests strong bullish momentum. When the MACD line is well below the signal line, it indicates strong bearish momentum. Traders can use this information to gauge the strength of a trend and make more informed trading decisions.
Using MACD in Different Market Conditions

One of the strengths of MACD is its versatility. It can be used in various market conditions, from trending markets to sideways markets. In a strong trending market, it excels at identifying the direction of the trend and providing timely entry and exit signals. However, in a sideways or range-bound market, it can produce false signals due to frequent crossovers. Traders should be cautious when using MACD in these conditions, as the indicator may not be as reliable.
To mitigate the risk of false signals, traders can use MACD in conjunction with other technical indicators, such as the Relative Strength Index (RSI) or support and resistance levels. By combining MACD with other tools, traders can confirm signals and reduce the likelihood of entering a trade based on a false signal.
Another strategy for using MACD in different market conditions is to adjust the time frame of the moving averages. For example, in a volatile market, traders might use shorter EMAs to capture more frequent price movements. In a slower market, longer EMAs can help smooth out the noise and focus on the underlying trend. The flexibility of MACD allows traders to adapt to changing market conditions and maintain an edge in their trading.
Common Pitfalls and How to Avoid Them
While MACD is a powerful tool, it’s not without its challenges. One common pitfall is relying solely on MACD for trading decisions. Because MACD is based on historical data, it can sometimes lag behind current market conditions. This lag can result in late entries or exits, particularly in fast-moving markets. To avoid this pitfall, traders should use it in conjunction with other indicators and market analysis.
Another challenge with MACD is its performance in non-trending markets. When the market is moving sideways, it can produce numerous false signals due to frequent crossovers. Traders should be aware of this limitation and avoid relying on it in range-bound markets. Instead, focus on using MACD in trending markets where its strengths can be fully utilized.
Additionally, traders should be cautious of overfitting their MACD settings. It’s tempting to adjust the MACD parameters to fit past data perfectly, but this can lead to poor performance in real-time trading. Instead, use the default settings (12, 26, 9) as a starting point and make adjustments based on your trading style and market conditions. By avoiding these common pitfalls, traders can use it more effectively and improve their trading outcomes.
Conclusion: Elevate Your Trading with MACD
MACD is a versatile and reliable momentum indicator that can significantly enhance your trading strategy. Whether you’re engaged in trend following or momentum trading, It provides valuable insights into market trends and momentum shifts. By understanding how to read the MACD line, signal line, and histogram, traders can make more informed decisions and improve their chances of success.
The signal line’s importance, combined with the ability to use MACD in different market conditions, makes it a go-to tool for traders. However, like any technical indicator, It should be used as part of a broader trading strategy. By combining it with other indicators and market analysis, traders can minimize risks and maximize their trading potential.
In the ever-changing world of trading, having a reliable tool like MACD in your arsenal can make all the difference. By mastering MACD and using it to its full potential, you can elevate your trading and achieve greater success in the markets. Whether you’re a novice trader or an experienced professional, it is a technical indicator that deserves a place in your trading toolkit.
Click here to read our latest article Harness Economic Indicators in Forex for Smarter Trading