
Pivot Points are indispensable in Forex Trading. They serve as a reliable tool for traders to predict market trends. In this comprehensive guide, we will explore how it can help you achieve consistent wins in Forex. Understanding and using them correctly can transform your trading strategy. It will enable you to identify potential support and resistance levels effectively. This article will delve into various aspects of Pivot Points, ensuring you master this essential technical analysis tool.
Understanding Pivot Points in Forex Trading
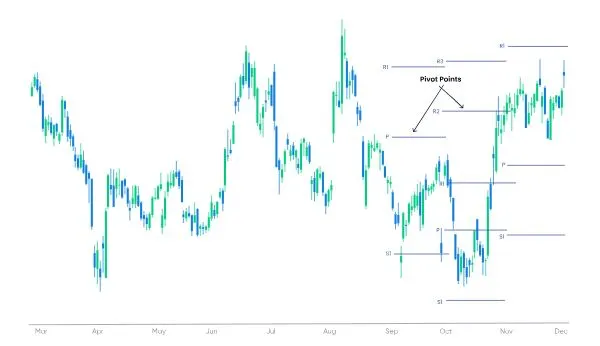
Pivot Points are a fundamental component of technical analysis. Traders use them to determine potential turning points in the market. These points help identify where a currency pair might experience support or resistance. The use of it in Forex Trading is widespread. This is because they provide a clear framework for analyzing price movements.
A Pivot Point is calculated based on the previous day’s high, low, and closing prices. The resulting value represents the central point around which the price movement is expected to pivot. If the price trades above this central Pivot Point, it indicates a bullish trend. Conversely, if the price trades below it, a bearish trend is likely.
Pivot Points not only help in predicting market direction but also assist in identifying key levels. These levels include support and resistance, which are crucial for making trading decisions. By understanding where these levels are, traders can set their entry and exit points with greater accuracy.
How to Calculate Pivot Points?
Calculating it is straightforward. The central Pivot Point is derived by taking the average of the previous day’s high, low, and closing prices. The formula is as follows:
Central Pivot Point = (Previous Day’s High + Low + Close) / 3
Once you have calculated the central Pivot Point, you can determine the support and resistance levels. These levels are critical in Forex Trading as they indicate potential areas where the price might reverse.
The first support (S1) and resistance (R1) levels are calculated as follows:
S1 = (2 * Central Pivot Point) – Previous Day’s High
R1 = (2 * Central Pivot Point) – Previous Day’s Low
The second level of support (S2) and resistance (R2) is calculated using the following formulas:
S2 = Central Pivot Point – (R1 – S1)
R2 = Central Pivot Point + (R1 – S1)
Finally, the third support (S3) and resistance (R3) levels are calculated as:
S3 = Central Pivot Point – (R2 – S2)
R3 = Central Pivot Point + (R2 – S2)
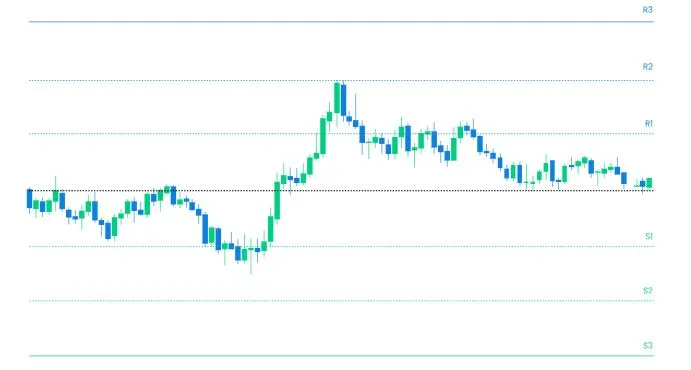
These levels provide traders with a roadmap to anticipate where the market might find support or face resistance. Understanding these levels is crucial for effective currency pair trading.
Types of Pivot Points and Their Uses
There are several types of Pivot Points, each with its own calculation method and trading application. The most common types include the Standard Pivot Point, Woodie’s Pivot Point, Fibonacci Pivot Point, Camarilla Pivot Point, and Demark Pivot Point.
Standard Pivot Point
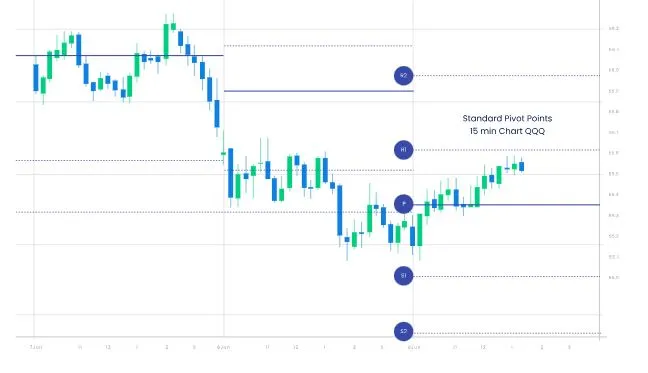
The Standard Pivot Point is the most basic and widely used. It is calculated using the central Pivot Point formula mentioned earlier. This type is ideal for day traders who need quick insights into market trends. It helps identify key support and resistance levels in a straightforward manner.
Woodie’s Pivot Point
Woodie’s Pivot Point gives more weight to the closing price. This makes it more sensitive to price changes. Traders often use this type in volatile markets. It is particularly useful in Forex Trading when you need to make rapid decisions based on short-term price movements.
Fibonacci Pivot Point
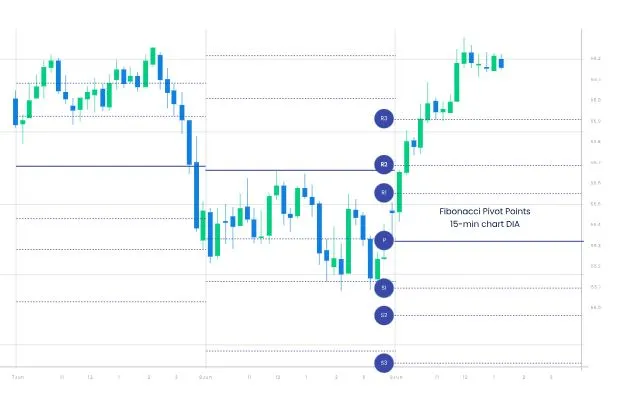
Fibonacci Pivot Points incorporate Fibonacci retracement levels into their calculation. These levels are based on key percentages that predict potential reversal points. Traders who use Fibonacci Pivot Points aim to identify more precise support and resistance levels.
Camarilla Pivot Point
It is an advanced version of Woodie’s Pivot Points. They focus on multiple support and resistance levels, making them ideal for range-bound markets. Traders can use these points to identify potential entry and exit points with greater precision.
Demark Pivot Point
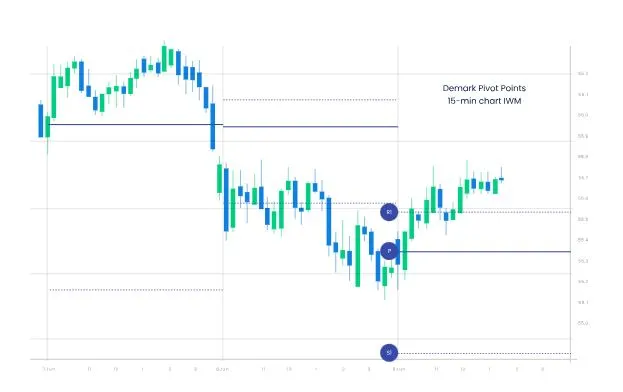
The Demark Pivot Point differs from other types as it uses a different calculation method. It emphasizes the current price action and provides a single level of support and resistance. This type is beneficial for traders focusing on short-term price movements.
Pivot Points in Technical Analysis
Incorporating Pivot Points into your technical analysis can significantly enhance your trading strategy. These points help identify potential reversal areas in the market. This makes them an essential tool for both novice and experienced traders.
Pivot Points are especially useful in identifying the overall market sentiment. If the price is above the central Pivot Point, it signals a bullish market. Conversely, if the price is below the Pivot Point, it indicates a bearish market. This information is crucial for making informed trading decisions.
Additionally, these Points help in setting stop-loss and take-profit levels. By identifying key support and resistance levels, traders can determine where to place their stop-loss orders. This reduces potential losses. Similarly, take-profit levels can be set at resistance points to maximize gains.
Pivot Points vs. Fibonacci Retracements
Pivot Points and Fibonacci Retracements are both popular tools in technical analysis. However, they serve different purposes. These Points provide a more structured approach to identifying key levels in the market. In contrast, Fibonacci Retracements focus on identifying potential reversal points within a trend.
Pivot Points use fixed levels based on the previous day’s price action. This makes them ideal for day traders who need quick and reliable signals. On the other hand, Fibonacci Retracements use percentages to identify key levels. These levels are based on the range between two significant price points.
While both tools are useful, they complement each other when used together. Traders often use Pivot Points to identify the overall trend. Then, they use Fibonacci Retracements to pinpoint precise entry and exit points within that trend.
Trading Strategies Using Pivot Points
There are several trading strategies that incorporate Pivot Points. Each strategy leverages the predictive power of Pivot Points to identify potential trade opportunities.
Breakout Trading Strategy
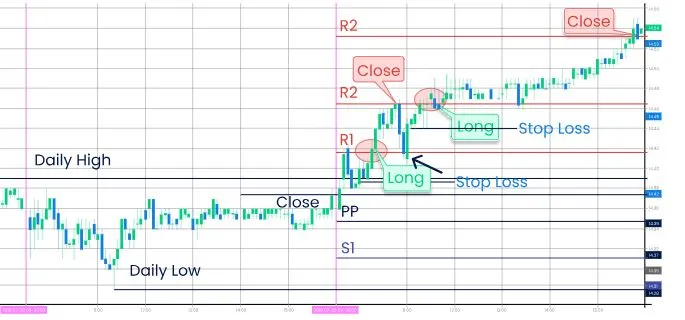
The Breakout Trading Strategy is one of the most popular. Traders look for price breakouts above resistance or below support levels. When the price breaks above a resistance level, it signals a bullish trend. Conversely, a break below a support level indicates a bearish trend.
In this strategy, traders place buy orders above the resistance level and sell orders below the support level. This allows them to capitalize on the momentum generated by the breakout.
Bounce Trading Strategy
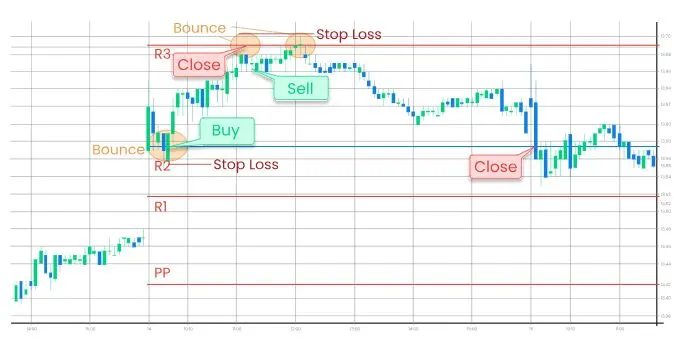
The Bounce Trading Strategy focuses on the price bouncing off support or resistance levels. If the price approaches a support level and then bounces upward, it signals a potential buying opportunity. Similarly, if the price approaches a resistance level and then bounces downward, it signals a potential selling opportunity.
This strategy is particularly effective in range-bound markets. Traders can profit from the repeated bouncing of the price between support and resistance levels.
Moving Average Convergence Divergence (MACD) Trading Strategy
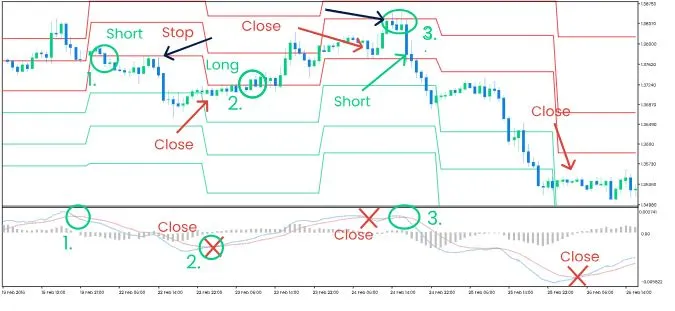
The MACD Trading Strategy combines Pivot Points with the MACD indicator. Traders use this strategy to identify potential reversals in the market. When the MACD line crosses above the Pivot Point, it signals a bullish trend. Conversely, when the MACD line crosses below the Pivot Point, it signals a bearish trend.
This strategy is effective in identifying the overall trend direction and potential entry and exit points.
Candlestick Pattern Strategy
The Candlestick Pattern Strategy uses Pivot Points in conjunction with candlestick patterns. Traders look for specific candlestick patterns, such as Doji or Hammer, near Points. These patterns often indicate potential reversals.
When a bullish candlestick pattern forms near a support level, it signals a potential buying opportunity. Conversely, a bearish candlestick pattern near a resistance level signals a potential selling opportunity.
Maximizing Gains with Pivot Points
Pivot Points are an invaluable tool in Forex Trading. They help traders identify key levels in the market where prices are likely to reverse. By incorporating Pivot Points into your trading strategy, you can improve your chances of making consistent profits.
To maximize gains, it is essential to combine Pivot Points with other technical analysis tools. For example, using Pivot Points with Fibonacci Retracements can provide more accurate entry and exit points. Similarly, combining Points with indicators like MACD or RSI can help confirm potential trade opportunities.
Moreover, always keep an eye on the overall market sentiment. If the market is trending strongly in one direction, use it to find entry points in the direction of the trend. Avoid trading against the trend unless there is a strong reversal signal.
Conclusion
Pivot Points are a powerful tool in Forex Trading. They help traders identify potential support and resistance levels. This enables traders to make informed decisions. By mastering Pivot Points, you can achieve consistent wins in Forex.
Remember, the key to success is combining Pivot Points with other technical analysis tools. This will provide a comprehensive view of the market. With practice and experience, you will be able to use Pivot Points effectively. This will enhance your trading strategy and increase your chances of success.
Start incorporating Pivot Points into your trading today. You’ll soon see the difference it makes in your trading performance. Happy trading!
Click here to read our latest article Harness Average True Range for Confident Market Moves