

The RSI is a powerful tool in Forex trading. Traders use the RSI to make informed decisions and increase profitability. This momentum oscillator, developed by J. Welles Wilder, measures the speed and volatility of price movements. By understanding and implementing this indicator strategies, traders can effectively navigate overbought and oversold conditions in the market. In this guide, we will dive into the essentials of RSI, including its calculation, application, and how it fits into technical analysis.
What is RSI?
The RSI (Relative Strength Index) is a momentum oscillator that helps traders assess the strength of a currency pair’s price movements. It is a key component of technical analysis and ranges from 0 to 100. The indicator is displayed as a line graph below the price chart. When the RSI is above 70, it indicates overbought conditions. Conversely, when it falls below 30, it signals oversold conditions. These signals are crucial for identifying potential entry and exit points in Forex trading.
RSI Calculation
Understanding how to calculate the RSI is vital for using it effectively in Forex trading. The formula for RSI is straightforward:
RSI = 100 – (100 / (1 + RS))
Here, RS represents the average profit divided by the average loss over a specified period. Typically, traders use a 14-day period for this calculation. The calculation involves determining the average profit and loss over this period. The average profit is the total profit during the period divided by the number of periods. Similarly, the average loss is the total loss during the period divided by the number of periods.
After calculating the average profit and loss, you can compute the value. If the RSI is above 70, it indicates overbought conditions. If it is below 30, it suggests oversold conditions. These levels help traders identify potential price reversals or continuations.
How to Use RSI in Forex Trading?
It is versatile and can be applied in various ways in Forex trading. Its primary function is to identify overbought and oversold conditions. However, traders can use it for much more. Here are some key methods to use RSI effectively:
Overbought Conditions
When it exceeds 70, the market may be in overbought conditions. This suggests that the price has risen too quickly and might soon reverse. Traders can use this signal to exit long positions or enter short positions. A bearish candlestick pattern following an RSI above 70 often confirms a potential reversal.
Oversold Conditions
Conversely, when it drops below 30, it indicates oversold conditions. This implies that the price has dropped too quickly and could reverse upwards. Traders might consider entering a buy position or exiting short positions at this point. A bullish candlestick pattern after the RSI dips below 30 can confirm the reversal.
Divergence
Divergence occurs when the price and RSI move in opposite directions. This is a critical signal in technical analysis and can indicate a trend reversal.
- Positive Regular Divergence: If the price makes a lower low, but it makes a higher low, it suggests that the downtrend is weakening. This is an opportunity to buy.
- Negative Regular Divergence: If the price makes a higher high, but it makes a lower high, it indicates that the uptrend is weakening. Traders might consider selling.
Break Confirmation and Trend Reversal
The RSI is also useful for confirming breaks and trend reversals in Forex trading. When the price breaks through a key resistance level, traders often seek confirmation from the RSI. If it remains above 50 after the break, the upward trend is likely to continue. Conversely, if it drops below 50, the break might be false, and the price could fall back below the resistance.
Using the 50 Level
The 50 level can act as a support or resistance level. When the RSI crosses the 50 level, it can signal a shift in market sentiment. Traders can use this information to predict potential price reactions and adjust their RSI indicator strategies accordingly.
Advantages and Disadvantages of RSI
While the RSI is a valuable tool in technical analysis, it is essential to understand its pros and cons. This will help traders use it more effectively in Forex trading.
Advantages of RSI
- Easy to Understand: It is straightforward and visually intuitive. Even beginners can quickly learn to interpret the signals it provides.
- Identifying Overbought and Oversold Conditions: The RSI excels at identifying overbought and oversold conditions. This can help traders avoid entering trades at unfavorable prices.
- Confirmation Tool: It works well with other technical analysis tools. It can confirm signals from chart patterns or moving average crossovers.
- Versatility: It can be applied to any currency pair and time frame, making it a versatile tool in Forex trading.
Disadvantages of RSI
- Lagging Indicator: The indicator reacts to past price movements, which means there can be a delay in the signals it generates. This lag can lead to missed opportunities or late trade entries.
- False Signals: Like any indicator, it can produce false signals. Traders must use other tools to confirm RSI signals to avoid premature trade entries or exits.
- Market Volatility: In volatile market conditions, it may fluctuate rapidly, leading to inaccurate signals. Traders should exercise caution in such environments.
- Limited Information: While it provides valuable insights into overbought and oversold conditions, it does not account for fundamental factors or market sentiment. This limitation highlights the importance of using it alongside other analysis tools.
Two Simple RSI Indicator Strategies
To effectively use it in Forex trading, it’s essential to have well-defined strategies. Here are two simple RSI indicator strategies that can be applied to various market conditions.
RSI Volatility Strategy
The volatility strategy works across all time frames and market conditions. It is particularly effective in identifying potential trend reversals.
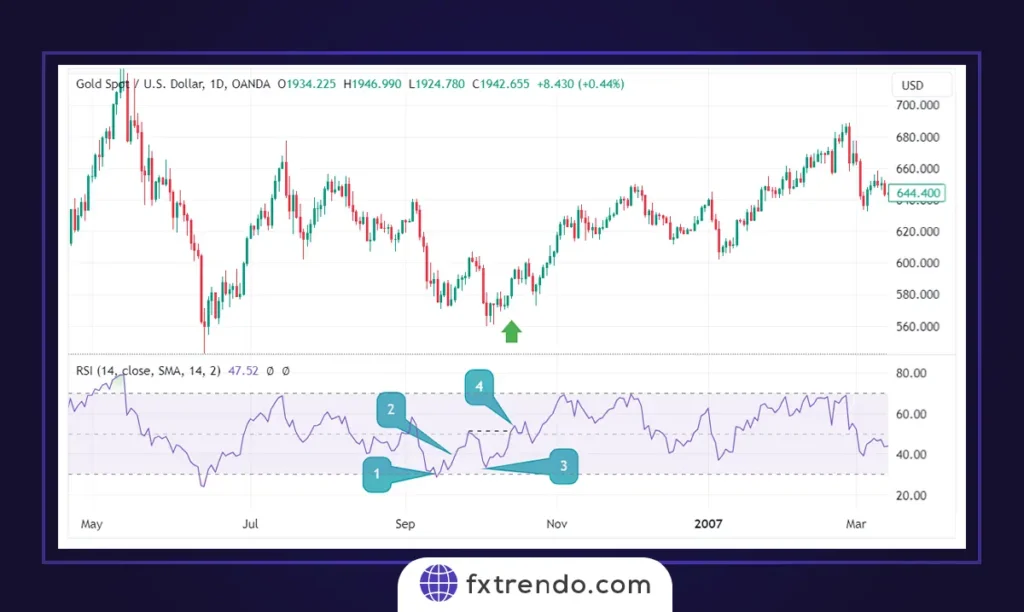
- For Buy: When the RSI enters oversold conditions and then reverses, it signals that sellers are losing control. If the RSI continues to rise, it indicates that buyers are gaining momentum. This is a strong buy signal.
In the image below, you can see that point 1 marks the entry of the price into the oversold zone, suggesting that sellers in this currency pair are losing strength, and a trend reversal may soon occur. Point 2 illustrates the price rebounding from the oversold area. Point 3 indicates another attempt by the sellers to push the price down, but at point 4, the strong buying pressure halts their progress, allowing the buyers to take control of the market.
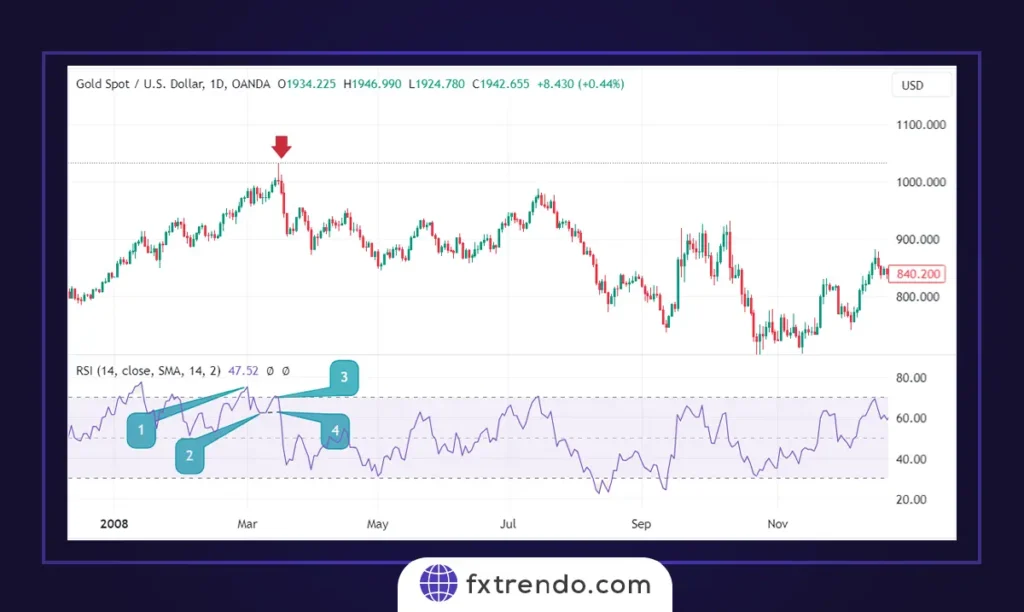
- For Sell: When the RSI enters overbought conditions and then reverses, it suggests that buyers are weakening. If the RSI continues to fall, it shows that sellers are taking control. This is a strong sell signal.
In the image below, point 1 indicates that the price has entered the overbought zone, suggesting that buyers in this currency pair are likely losing strength, and a trend reversal is anticipated. Point 2 shows the price reversing from the overbought area. Point 3 illustrates another attempt by the buyers to push the price higher, but point 4 demonstrates strong selling pressure that prevents further upward movement, allowing the sellers to take control of the market.
Trend Line in the RSI Chart
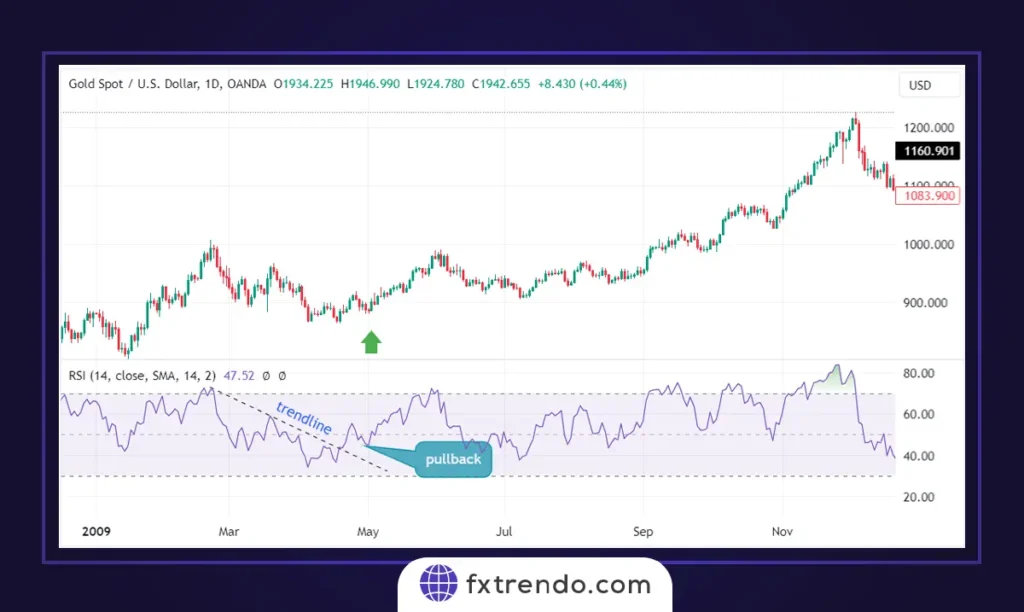
Most traders know that trend lines can be drawn on price charts. However, they may not realize that the same can be done on the RSI chart. Drawing trend lines on it can provide additional insights into potential market movements.
- For Buy: If the RSI breaks above a trend line and pulls back to it, this is a sign of a potential upward movement. Traders can enter a buy trade when the it bounces off the trend line.
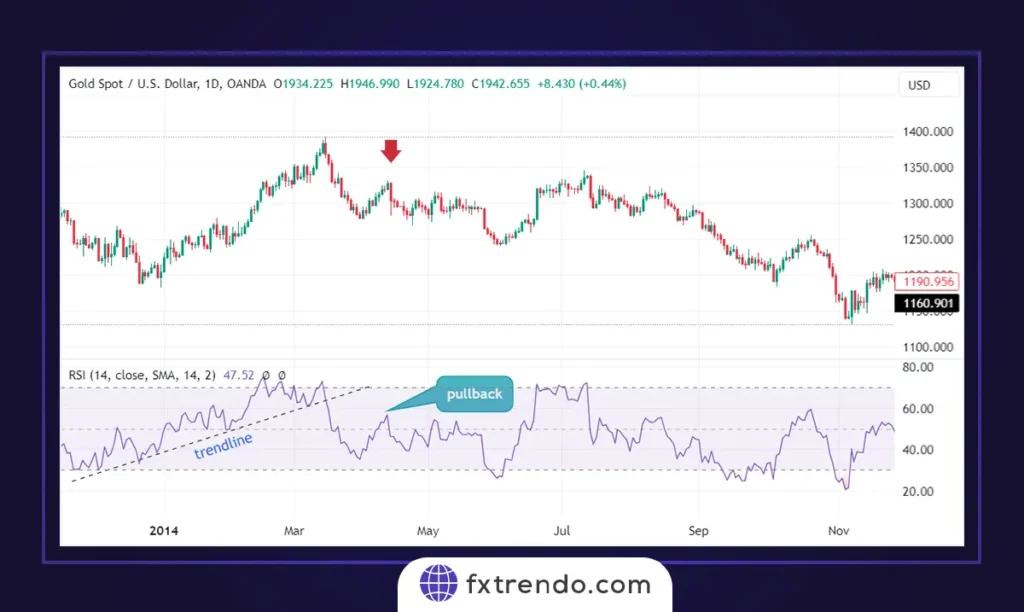
- For Sell: If the RSI breaks below a trend line and then pulls back to it, this indicates a potential downward movement. Traders can enter a sell trade when the RSI falls off the trend line.
Conclusion
The RSI is a powerful tool in technical analysis that can significantly amplify your Forex trading success. By understanding how to calculate and apply the RSI, traders can identify overbought and oversold conditions with greater accuracy. Whether you use it to confirm trend reversals or as part of a more comprehensive indicator strategy, it is crucial to understand its advantages and limitations. Incorporating the it into your trading strategy, along with other tools, can lead to more informed and profitable trades. Always remember that while it is an essential part of technical analysis, it should not be used in isolation. Combine it with other indicators and market analysis techniques to ensure a well-rounded approach to Forex trading.
Click here to read our latest article Harness Average True Range for Confident Market Moves