

Introduction
In the world of Forex trading, success often hinges on a trader’s ability to recognize and interpret key patterns and signals. One such pattern that has captured the attention of traders worldwide is the “Rising Wedge Pattern.” This pattern, with its potential for both reversal and continuation, can be a powerful tool in a trader’s arsenal. In this comprehensive guide, we will delve deep into the Rising Wedge Pattern, uncover its nuances, and explore how it can be used to enhance your Forex trading success.
What is a Rising Wedge Pattern?
Definition and Characteristics of the Rising Wedge Pattern
The Rising Wedge Pattern, often referred to as the ascending wedge pattern, is a prominent and intricate price consolidation formation observed in financial markets. This pattern arises when the price of an asset is progressively confined within the converging boundaries of two ascending trend lines. Understanding the core definition and characteristics of the Rising Wedge Pattern is crucial for traders seeking to harness its predictive power.
- Two Ascending Trend Lines: At the heart of the Rising Wedge Pattern are two ascending trend lines that act as critical boundaries. The upper trend line connects the highs, while the lower trend line links the lows. These trend lines collectively encapsulate the price movement, creating a distinctive pattern.
- Narrowing Price Range: A hallmark feature of the Rising Wedge Pattern is its narrowing price range. As time progresses, the distance between the two trend lines diminishes, forming a wedge-like shape. This tightening price range serves as an indication of diminishing price volatility.
- Resemblance to an Upward-Tilting Triangle: Visualizing the Rising Wedge Pattern, one might notice its resemblance to an upward-tilting triangle. This triangle shape reinforces the pattern’s bullish-to-bearish transition, making it easier for traders to identify and interpret.
- Occurrence After an Uptrend: Typically, the Rising Wedge Pattern emerges after a prolonged uptrend. It signifies a period of price consolidation and potential trend reversal. This consolidation phase is essential for traders to recognize as it often heralds significant price movements.
Distinction from the Falling Wedge Pattern
To grasp the Rising Wedge Pattern fully, it’s essential to contrast it with its counterpart, the Falling Wedge Pattern. While both patterns involve the convergence of trend lines, they diverge significantly in their implications for price movement.
- Falling Wedge Pattern – Bullish Signal: The Falling Wedge Pattern, in contrast to the Rising Wedge Pattern, is considered a bullish signal. It forms when the price is confined between two descending trend lines. This pattern suggests potential upward price movement, indicating the possibility of a trend reversal from bearish to bullish.
- Rising Wedge Pattern – Bearish Signal: On the other hand, the Rising Wedge Pattern is inherently bearish. When this pattern materializes within an existing uptrend, it signifies the potential for a trend reversal from bullish to bearish. Traders should view it as a warning sign of weakening bullish momentum.
Why it’s Considered a Bearish Chart Formation
Understanding why the Rising Wedge Pattern is regarded as a bearish chart formation is pivotal for traders aiming to capitalize on its predictive capabilities.
- Weakening Bullish Momentum: The Rising Wedge Pattern’s bearish implication arises from its ability to signal a diminishing bullish momentum. As the price continues to make higher highs and higher lows within the narrowing wedge, it indicates that buyers are struggling to maintain control. This weakening bullish sentiment sets the stage for a potential bearish reversal.
- Potential for Trend Reversal: When the Rising Wedge Pattern appears during an uptrend, it signifies that the prevailing uptrend may be losing steam. Traders interpret this as a possible shift in market sentiment from bullish to bearish. While not all Rising Wedge Patterns result in a trend reversal, they serve as early warnings of the potential for a downward correction or a more extended bearish trend.
The Potential for Both Reversal and Continuation Patterns
One of the remarkable attributes of the Rising Wedge Pattern is its versatility. Unlike some chart patterns that exclusively indicate one specific outcome, the Rising Wedge Pattern can exhibit characteristics of both reversal and continuation patterns.
- Reversal Pattern: In certain market conditions, the Rising Wedge Pattern functions as a powerful reversal signal. It indicates a possible shift from an existing uptrend to a bearish reversal. Traders who recognize this pattern during an uptrend may choose to take caution or consider short positions.
- Continuation Pattern: Conversely, in other scenarios, the Rising Wedge Pattern can act as a continuation pattern. This suggests that the prevailing trend, whether bullish or bearish, may continue following the consolidation phase. Traders should remain flexible and consider the broader market context and price action when determining the likely outcome of the Rising Wedge Pattern.
In summary, the Rising Wedge Pattern is a dynamic and multifaceted chart formation that provides traders with valuable insights into market sentiment and potential future price direction. Recognizing its characteristics, differentiating it from the Falling Wedge Pattern, understanding its bearish implications, and acknowledging its potential for both reversals and continuations are key steps toward mastering this pattern for success in Forex trading.
How to Spot a Rising Wedge on Forex Charts
Identifying a Pattern of Continuation
In the intricate world of Forex trading, recognizing and interpreting chart patterns like the Rising Wedge Pattern is a valuable skill that can lead to profitable trades. Within this pattern, traders often encounter scenarios where the Rising Wedge signals a continuation of the existing trend. To effectively identify and capitalize on such situations, it is essential to follow a structured approach:
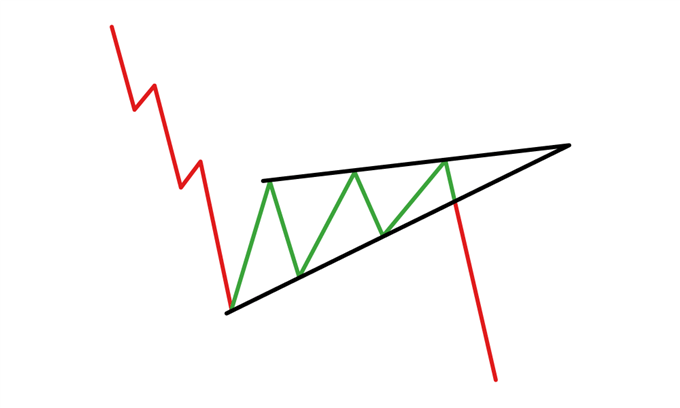
- Clear Downward Trend: The first step in identifying a Rising Wedge Pattern indicating a continuation pattern is to ascertain the presence of a clear downward trend preceding the pattern’s formation. This prior trend sets the stage for potential continuation.
- Building the Rising Wedge Consolidation: Once you’ve established the downtrend, keep a vigilant eye for the development of the Rising Wedge Pattern. This pattern takes shape as two converging trend lines gradually squeeze the price action within them. As the price moves within these boundaries, it creates the characteristic wedge shape.
- Using Trend Lines: The Rising Wedge Pattern’s essence lies in its trend lines. Draw trend lines that connect the higher highs and lower lows formed within the pattern. This step helps visualize the pattern’s structure and confirms its existence.
- Verifying Price-Volume Divergence: Confirming the pattern’s continuation aspect involves analyzing price-volume divergence. Observe the relationship between price movements and trading volume. A decrease in trading volume as the price consolidates within the Rising Wedge Pattern can serve as a confirmation of the pattern’s continuation potential. Additionally, consider using technical indicators like the Moving Average Convergence Divergence (MACD) to further validate this divergence.
- Utilizing Technical Indicators: Technical indicators such as oscillators, Relative Strength Index (RSI), or Stochastic Oscillator can offer valuable insights into the market’s overbought or oversold conditions. Incorporate these indicators into your analysis to strengthen your confirmation of the continuation pattern.
- Entry Points: Identifying potential entry points is a critical aspect of trading the continuation pattern within the Rising Wedge. Look for a decisive break below the support level of the pattern as a potential entry point for a short trade. This break below the support level can signify a resumption of the previous downtrend, aligning with the continuation pattern’s implications.
Identifying a Reversal Pattern
Conversely, the Rising Wedge Pattern can also serve as a harbinger of a potential trend reversal within an existing uptrend. Identifying this reversal pattern is essential for traders seeking to navigate market shifts. Here’s how to identify it:
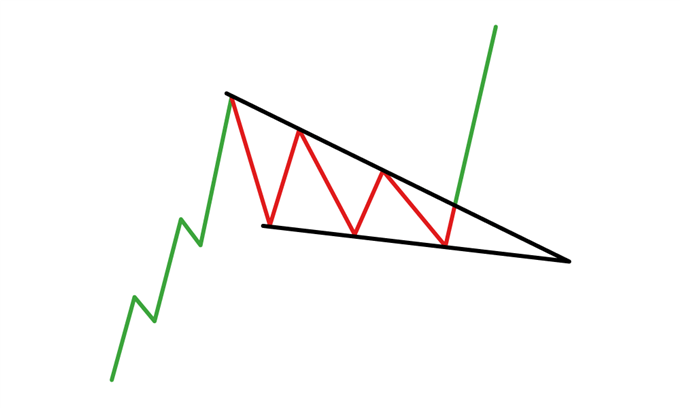
- Existing Upward Trend: Begin by recognizing the presence of a robust upward trend that precedes the formation of the Rising Wedge Pattern. This upward trend sets the context for a potential reversal.
- Building the Rising Wedge Consolidation: As with the continuation pattern, closely monitor the emergence of the Rising Wedge Pattern. It will still consist of two converging trend lines, but in this case, it signals a potential shift in sentiment from bullish to bearish.
- Using Trend Lines: Draw trend lines to connect the higher highs and lower lows that form within the pattern. These trend lines become crucial reference points to understand the pattern’s structure.
- Verifying Price-Volume Divergence: Similar to the continuation pattern, assess price-volume divergence as a means of confirming the reversal aspect of the Rising Wedge Pattern. A decrease in trading volume as the price consolidates within the wedge can be indicative of a potential reversal. Employ technical indicators like MACD to bolster this confirmation.
- Utilizing Technical Indicators: Leverage technical indicators, such as oscillators, RSI, or Stochastic Oscillator, to validate the overbought condition within the pattern. A rising wedge within an uptrend often leads to overbought market conditions, strengthening the reversal signal.
- Entry Points: When considering a reversal pattern within the Rising Wedge, look for entry opportunities that align with a potential shift from the existing uptrend to a downtrend. A short trade entry may be initiated when the price convincingly breaks below the support level, signifying a possible reversal of the prior bullish trend.
In both scenarios—identifying a continuation pattern or recognizing a reversal pattern—it’s crucial for traders to maintain a vigilant and adaptive approach. The Rising Wedge Pattern’s ability to serve as both a continuation and a reversal signal underscores its complexity and underscores the importance of thorough analysis and strategic decision-making in Forex trading.
Trading the Rising Wedge Pattern
Now that we’ve delved into the intricacies of identifying and understanding the Rising Wedge Pattern, it’s time to explore how traders can effectively trade this pattern in real-world scenarios. This section provides insights into trading strategies and risk management techniques associated with the Rising Wedge Pattern.
Real-Life Example (e.g., EUR/USD Chart)
To grasp the practical application of the Rising Wedge Pattern, let’s examine a real-life example using the EUR/USD currency pair chart:
In this chart, the context begins with a clear and established downtrend. This is a critical factor as the Rising Wedge Pattern often emerges after a sustained downward movement. As the pattern forms, it is delineated by the placement of blue dashed lines, marking the boundaries of the wedge. These lines represent the narrowing price range within which the asset is trading.
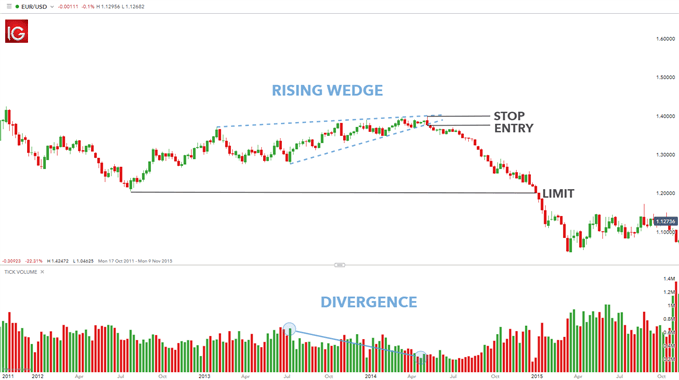
However, what makes this example particularly noteworthy is the supporting evidence provided by volume analysis. As traders use the volume tool on the chart, they can observe a decline in trading volume occurring in tandem with the rising prices within the pattern. This volume-price divergence corroborates the weakening bullish strength that the Rising Wedge Pattern implies.
Additionally, traders keen on spotting potential reversal signals may take note of divergence. Divergence, in this context, suggests that the upward momentum is losing steam, indicating a possible change in market sentiment.
Entry and Exit Strategies
Effectively trading the Rising Wedge Pattern involves a structured approach to entry and exit points. Here are the key strategies:
- Two Typical Entry Approaches:
- Waiting for a Candle to Close Below the Support Trend Line: This entry strategy entails patience. Traders wait for a candlestick to convincingly close below the support trend line of the Rising Wedge Pattern. This closure signifies a potential breakdown and reversal, providing a confirmation signal. By waiting for this confirmation, traders aim to reduce false signals.
- Initiating a Short Trade as Soon as the Price Breaches the Support Line: In this approach, traders act swiftly as soon as the price breaches the support line, regardless of how the candlestick closes. This strategy seeks to capitalize on early signs of a potential reversal, providing a jump on the market. However, it comes with a slightly higher risk of false signals.
- Setting Stop Levels: Determining stop levels is an integral aspect of risk management when trading the Rising Wedge Pattern. Traders can identify their stop levels based on the peak point of the Rising Wedge Pattern, which typically occurs at the resistance trend line. This point serves as a clear reference for setting stop levels.
Setting stop levels at this juncture offers several advantages:
- Clarity: It provides traders with a straightforward reference point for their stop-loss orders, reducing ambiguity in trade management.
- Risk-Reward Ratio: The position of the stop level relative to the entry point can be used to establish a favorable risk-reward ratio. Traders can calculate the potential reward based on the distance to their target levels.
- Confirmation of Breakdown: The stop level’s placement at the resistance trend line confirms that the pattern has indeed been breached, adding an extra layer of confirmation.
By setting stop levels at the peak of the Rising Wedge Pattern, traders can effectively manage risk while also maximizing the potential for profit.
Risk-Reward Ratio Considerations
In the world of Forex trading, managing risk is paramount to long-term success. The Rising Wedge Pattern offers traders an advantage by providing clear entry and exit points, making it conducive to effective risk management.
When evaluating potential trades, it’s essential to assess the risk-reward ratio. This ratio is calculated by comparing the distance from the entry point to the stop level (risk) with the distance from the entry point to the target level (reward). A favorable risk-reward ratio often implies that the potential reward outweighs the risk taken.
By carefully considering and aligning the risk-reward ratio with each trade, traders can ensure that they have a systematic and sustainable approach to managing risk while trading the Rising Wedge Pattern.
Trading the Rising Wedge Pattern requires a combination of technical analysis, patience, and disciplined risk management. Traders who master this pattern can leverage its predictive capabilities to make informed trading decisions and maximize their potential for success in the Forex market.
Conclusion
In conclusion, mastering the Rising Wedge Pattern is a valuable skill for any Forex trader. This pattern, with its potential for both reversal and continuation, offers insights into market sentiment and potential price direction. By following the guidelines outlined in this comprehensive guide, you can enhance your ability to identify, interpret, and profit from the Rising Wedge Pattern. Remember that successful trading requires practice and discipline, so apply the knowledge gained in this article to your trading strategies and stay vigilant in the ever-changing world of Forex trading. This article has played a vital role in helping you unlock the potential of this bearish signal in Forex trading. Good luck and happy trading!
Click here to read our latest article on Understanding Retail Sales
FAQs
- What is the Rising Wedge Pattern in Forex trading? The Rising Wedge Pattern is a price consolidation formation observed in financial markets. It is characterized by two ascending trend lines that gradually converge, indicating potential bearish reversals or trend continuations.
- How is the Rising Wedge Pattern different from the Falling Wedge Pattern? While both patterns involve converging trend lines, the Rising Wedge Pattern is considered bearish and occurs in an uptrend. In contrast, the Falling Wedge Pattern is considered bullish and often appears in a downtrend.
- Why is the Rising Wedge Pattern considered bearish? It signals weakening bullish momentum and potentially flags a trend reversal from bullish to bearish, primarily when it appears during an uptrend.
- Can the Rising Wedge Pattern also indicate a continuation pattern? Yes, the Rising Wedge Pattern is versatile. It can act as both a reversal and a continuation pattern, depending on the broader market context.
- How do I identify a Rising Wedge on a Forex chart? Look for two converging, upward trend lines that encapsulate the price movement. As the pattern develops, the distance between the lines narrows, forming a wedge-like shape.
- What technical indicators can support the identification of a Rising Wedge Pattern? Oscillators, Relative Strength Index (RSI), and Moving Average Convergence Divergence (MACD) can be useful for confirming the pattern and assessing market conditions.
- What are some strategic entry points when trading a Rising Wedge Pattern? One approach is to wait for a candle to close below the support trend line. Another is to initiate a short trade as soon as the price breaches the support line.
- How do I set stop levels when trading this pattern? Stop levels can be set based on the peak point of the Rising Wedge Pattern, usually occurring at the resistance trend line, as part of effective risk management.
- What should I consider regarding the risk-reward ratio? Evaluate the distance from the entry point to the stop level (risk) against the distance from the entry point to the target level (reward). A favorable risk-reward ratio suggests the potential reward outweighs the risk.
- Do all Rising Wedge Patterns result in a price reversal or continuation? While the pattern is a strong indicator, it is not a guarantee. It should be used in conjunction with other indicators and strategies for more accurate predictions.
Click here to read our latest article on Rising Wedge Patterns