

Gold breakouts have always intrigued investors and market analysts. Since the end of the Gold Standard in 1971, gold has made several significant breakouts. Understanding these breakouts helps us navigate the precious metals market effectively. This article delves into historical gold prices and the patterns of gold breakouts. It explores the gold standard history and how market corrections impact these breakouts.
Gold Breakouts Post-Gold Standard

Since the end of the Gold Standard, gold breakouts have become a critical focus for investors. The transition away from the Gold Standard marked a significant shift in the financial world. This shift allowed gold prices to fluctuate freely in the market. Historical gold prices show that gold has made six major breakouts since 1971. Notably, only two of these breakouts retested the breakout levels. These were the breakouts to new all-time highs in 1978 and 2009.
The 1978 Gold Breakout: A Significant Event
The 1978 gold breakout was a significant event in the precious metals market. Gold gained an impressive 136% from its low in 1976 to its breakout in 1978. From the breakout to the first correction, gold gained another 25%. The market correction saw gold losing 20%, finding support at the 200-day moving average. This period is crucial in understanding the gold standard history and market corrections.
The period leading up to the 1978 breakout is interesting. During the mid-1970s, economic instability and inflation were high. This environment led to increased demand for gold. As investors sought safe-haven assets, gold prices began to rise. This trend culminated in the breakout of 1978. After the breakout, gold continued to surge until it faced its first major correction. The correction was a typical market reaction to overbought conditions.
In this correction, gold prices fell by 20%. This decline was substantial but not unexpected. The support at the 200-day moving average played a crucial role. It prevented further declines and stabilized the market. This support level is a common technical indicator used by traders. It helps them identify potential reversal points in the market. Historical gold prices often reflect this pattern.
The 2009 Gold Breakout: Mirroring the Past
The 2009 gold breakout mirrored some aspects of the 1978 breakout. Gold gained 80% from its low in 2008 to its breakout in 2009. From the breakout to the first correction, gold gained 21%. The subsequent correction saw gold declining by 15%, bottoming at its 150-day moving average. These patterns highlight the cyclical nature of gold prices and the impact of market corrections on gold breakouts.
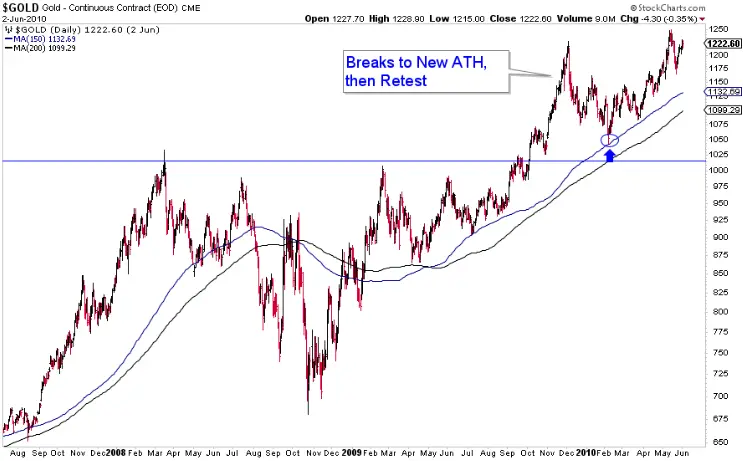
The 2008 financial crisis set the stage for the 2009 breakout. As global markets collapsed, investors flocked to gold. They viewed it as a safe investment. This surge in demand pushed gold prices higher. The breakout in 2009 was a direct result of these market dynamics. After the breakout, gold prices continued to rise. However, like in 1978, the market eventually corrected.
During the correction, gold prices fell by 15%. This decline was smaller than the 1978 correction. The 150-day moving average provided significant support. This support level is another key technical indicator. It helps investors understand potential price movements. The correction in 2009 was a temporary setback. After stabilizing, gold prices resumed their upward trend.
Gold Standard History and Market Corrections
Both the 1978 and 2009 gold breakouts offer valuable insights. They show how market conditions and investor behavior influence gold prices. The gold standard history is essential in this context. Understanding it helps investors navigate market corrections effectively. The end of the Gold Standard introduced new dynamics. These dynamics continue to shape the precious metals market.
Market corrections are a natural part of these dynamics. They occur when prices become overextended. Corrections help stabilize the market. They provide opportunities for new investments. Historical gold prices often reflect these patterns. By studying them, investors can identify potential entry points. They can also anticipate future market movements.
Recent Trends in Gold Breakouts
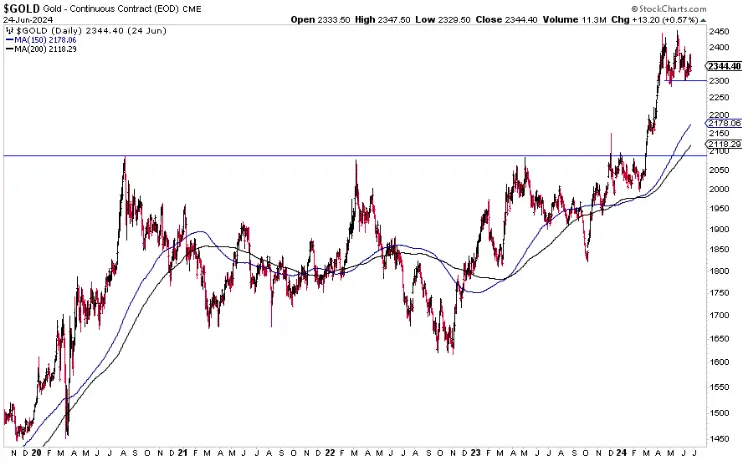
Recently, gold has shown significant gains from its lows in 2022. Gold gained 50% from its low to a recent peak. The post-breakout gain was 18%. However, gold has corrected by 6% thus far. This correction raises concerns among investors, especially with the threat of gold breaking below $2300. A test of $2150-$2175 would signify an 11%-12% correction. Such a correction could be seen as alarming, but it might also present new opportunities.
Factors Influencing Recent Gold Breakouts
Several factors influence these recent trends in gold breakouts. Economic uncertainties, geopolitical tensions, and inflation fears drive investors towards gold. Gold is considered a safe-haven asset. When the stock market is volatile, gold becomes an attractive investment. Historical gold prices reflect this tendency. The gold standard history underscores gold’s role in times of economic turmoil. Investors often flock to gold during crises, leading to significant price movements.
Another key factor is the monetary policy of major economies. Central banks’ interest rate decisions directly impact gold prices. When interest rates are low, the opportunity cost of holding gold decreases. This situation often leads to increased demand for gold. Market corrections in gold prices can result from changes in interest rate expectations. Thus, staying informed about economic policies is crucial for investors.
Technical Indicators and Market Sentiment
Technical indicators play a vital role in understanding gold breakouts. Moving averages, for instance, help identify trends and potential reversal points. The 200-day and 150-day moving averages are particularly significant. In the recent correction, gold found support near these levels. Historical gold prices show similar patterns during past corrections. Investors use these technical indicators to make informed decisions.
Market sentiment also influences gold prices. When investors are optimistic about the economy, they might move away from gold. Conversely, pessimism can drive them towards it. Monitoring market sentiment helps anticipate gold price movements. Sentiment can change rapidly, influenced by news events and economic data releases. By staying updated, investors can better navigate the precious metals market.
Potential Retest and Future Outlook
If gold loses $2300, a retest of $2100-$2150 is likely. Although such a correction may cause technical damage, it is not a major concern. If the US economy continues to slow, the odds of rate cuts will increase. This scenario will likely lead to a rebound in gold and other precious metals. Historical gold prices indicate that after retesting its breakout in 1978, gold gained 122% in 13 months. Similarly, after the 2009 retest, gold gained 63% in 13 months.
Historical Context and Market Cycles
The gold standard history provides valuable context for understanding current trends. Since the end of the Gold Standard, gold prices have experienced significant cycles. These cycles often include periods of rapid gains followed by corrections. By studying these cycles, investors can identify patterns and potential future movements. Historical gold prices serve as a guide for anticipating market behavior.
Market corrections are an integral part of these cycles. They help balance the market by correcting overbought conditions. Corrections can be seen as healthy for the long-term stability of gold prices. They also present opportunities for investors to enter the market at lower prices. Understanding these corrections in the context of gold breakouts is crucial for making informed investment decisions.
Investment Opportunities During Corrections

Market corrections often present excellent buying opportunities. If the current correction in gold continues, it will be a chance to buy high-quality juniors at attractive prices. Investors should understand the historical patterns of gold breakouts. This knowledge helps them make informed decisions during market corrections.
Learning from Historical Patterns
Gold breakouts offer valuable lessons for investors. The gold standard history shows that gold prices are cyclical. Major breakouts often lead to significant gains. However, corrections are also part of the process. By studying historical gold prices, investors can identify potential entry points. They can also understand the likely patterns of future breakouts and corrections.
For instance, during past corrections, gold has often found support at key technical levels. These levels include moving averages and Fibonacci retracement levels. Recognizing these patterns helps investors anticipate where the market might find support. This insight allows for strategic entry points during corrections. Historical gold prices provide a roadmap for understanding these movements.
Navigating the Precious Metals Market
The precious metals market is influenced by various factors. These include economic conditions, interest rates, and market sentiment. Gold breakouts are particularly sensitive to these factors. Investors must stay informed about these influences. They should also pay attention to technical indicators like moving averages. This approach helps them navigate the market effectively.
In addition to technical analysis, fundamental analysis is crucial. Understanding the broader economic context helps in making informed decisions. For example, central bank policies, inflation rates, and geopolitical events all play a role. These factors can drive gold prices up or down. By keeping an eye on these developments, investors can better predict market trends.
Strategic Planning for Future Investments
Investors should approach gold investments with a strategic plan. This plan should include both short-term and long-term perspectives. Short-term strategies might focus on technical indicators and market sentiment. Long-term strategies should consider economic fundamentals and historical patterns. Combining these approaches helps in making well-rounded investment decisions.
In conclusion, recent trends in gold breakouts highlight the importance of understanding market dynamics. By studying historical gold prices and the gold standard history, investors can gain valuable insights. Market corrections should not be feared but seen as opportunities. With a strategic approach, investors can navigate the precious metals market effectively. They can capitalize on the unique opportunities presented by gold breakouts and corrections.
Conclusion
Gold breakouts are a fascinating aspect of the precious metals market. Since the end of the Gold Standard, gold has made several significant breakouts. Historical gold prices show that these breakouts often lead to substantial gains. However, market corrections are also an integral part of this process. By understanding the gold standard history and the patterns of market corrections, investors can make informed decisions. They can capitalize on buying opportunities during corrections and benefit from the subsequent gains. As the market evolves, staying informed and vigilant is key to successful investing in gold and other precious metals.
Click here to read our latest article on Buy Now Pay Later Debt