TECHNICAL FORECAST FOR GOLD AND SILVER
- The US dollar‘s overall decline has boosted both gold and silver, but silver stands out among the two metals in terms of its positive climb.
- Gold: There is significant resistance at the psychological 1800 level and the 200-day SMA.
- Silver is trading above a large zone of support with no indications of slowing down.
Technical Forecast for Gold (XAU/USD): Mixed
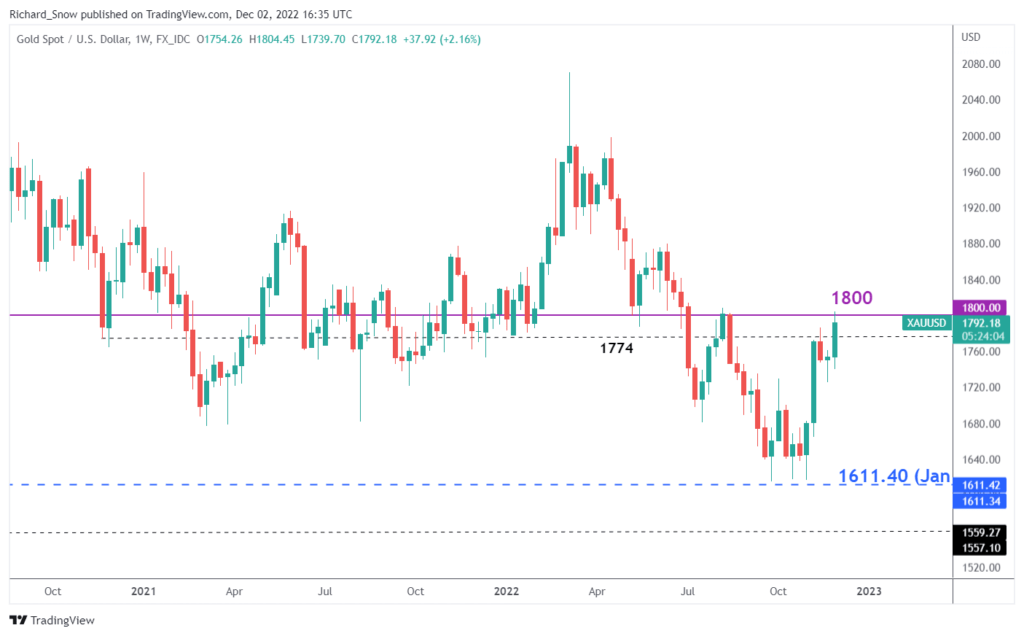
Due to falling US rates and a weaker currency, gold has had a great week of gains. To end the week, the precious metal is currently testing the psychological threshold of 1800. A third prolonged lower wick on the weekly time frame was enough to reject a move below and, instead, signal the beginning of a move higher, which led to the bullish advance. This rejection of the 1611.40 (Jan 2020) level was rather significant.
XAU/USD Weekly Chart for Gold
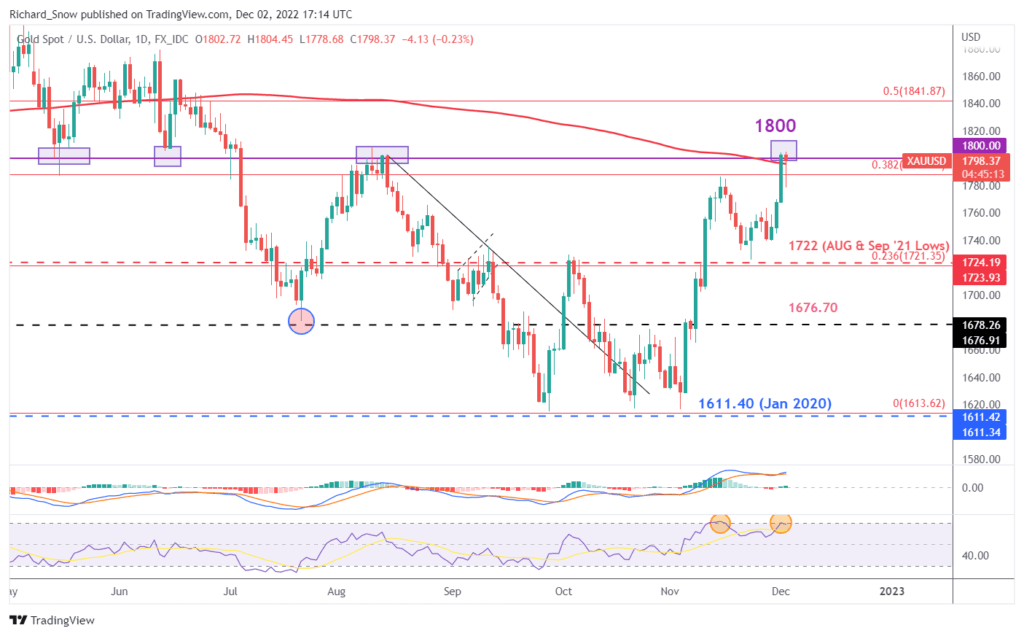
The possible region of resistance to gold’s upward movement may be seen on the daily chart. The purple rectangles show prior instances where price activity neared and eventually respected the 1800 level. The level has been regarded as both opposition and support, emphasizing its significance even more. Additionally, as the 200-day SMA also conveniently lies near the 1800 level, nothing less than a massive follow-through from gold bulls would likely be successful in raising prices from this point.
If prices calm before making another try towards 1800, a drop towards the 38.2% Fibonacci retracement of the 2022 big advance (1786) is still possible. The higher high from mid-November and the Fib level is likewise congruent. The RSI, which just left a short time in oversold territory, also points to a probable deceleration.
XAU/USD Daily Chart for Gold
Technical Prediction for Silver (XAG/USD): Bullish
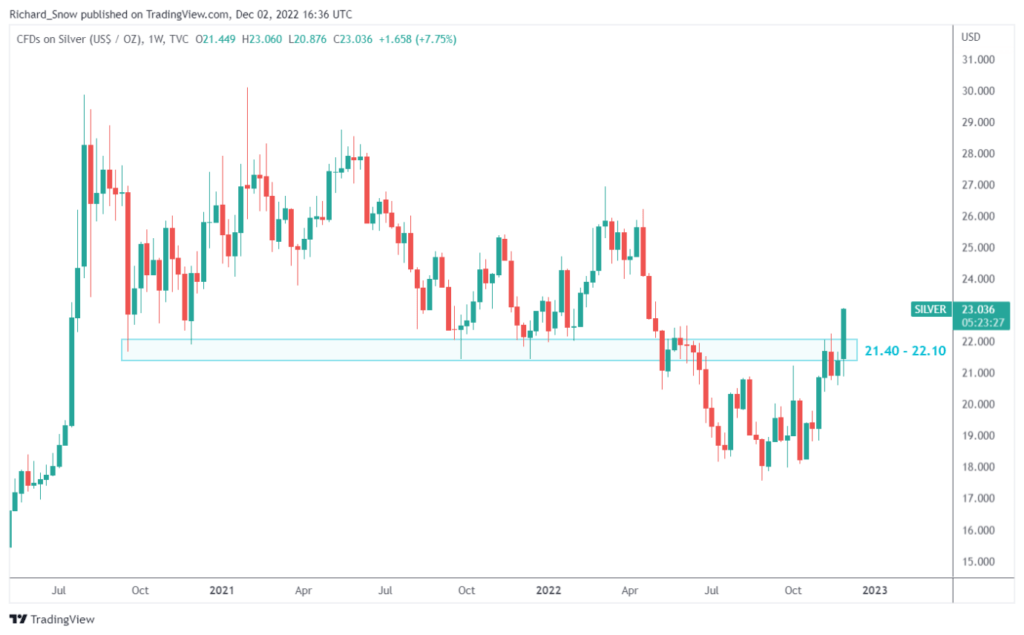
Silver keeps moving upward unabatedly, while gold seems to be consolidating. The metal was able to overcome the resistance area between 21.40 and 22.10 comfortably, and silver is still on pace to have its biggest weekly gain since July.
XAG/USD Weekly Chart for Silver
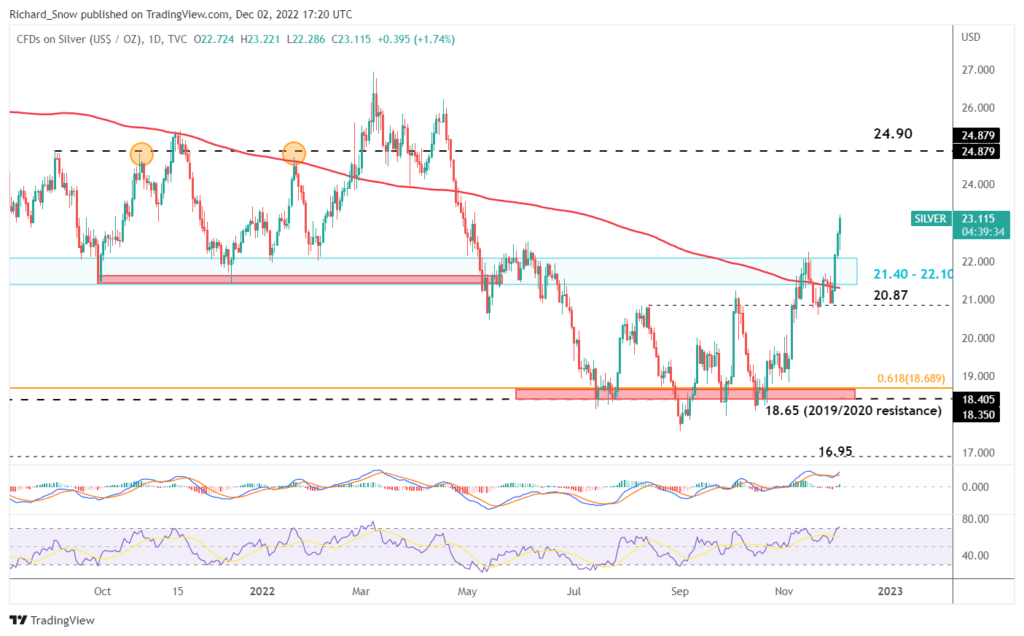
The vast amount of real estate that silver could trade into on the daily chart is shown by breaking all nearby resistance levels, including the 200 SMA and the previously indicated zone of resistance. The price movement was stopped around 24.90, which was the level of resistance reached in early 2022 and September and October 2021.
Silver’s RSI suggests that prices like gold may be ready for a fall soon. However, the signal has yet to dip into overbought territory, indicating that there may still be some additional higher opportunities. Support is found at 22.10 on the upper edge of the support zone (initial resistance).
XAG/USD Daily Chart for Silver