

In the world of trading, understanding price volatility is crucial for making confident market moves. One powerful tool to achieve this is the Average True Range (ATR). The ATR is an essential indicator that helps traders navigate the complexities of market volatility. By effectively using the Average True Range, traders can refine their trading strategies, identify optimal entry and exit triggers, and ultimately, enhance their overall market performance.
Understanding the Average True Range

The Average True Range, developed by J. Welles Wilder, is a key indicator of price volatility. It measures the average variation in price over a specific time period, typically using 14 periods. The ATR is not just a tool for measuring volatility; it also accounts for price gaps, making it more comprehensive. This feature is crucial in markets where prices can jump significantly between trading sessions.
The Average True Range calculates volatility by evaluating the true range of price movements. The true range is the greatest of the following three values: the current high minus the current low, the absolute value of the current low minus the previous close, or the absolute value of the current high minus the previous close. By averaging these values over a specified period, traders get a clear picture of market volatility.
The Role of ATR in Price Volatility Analysis
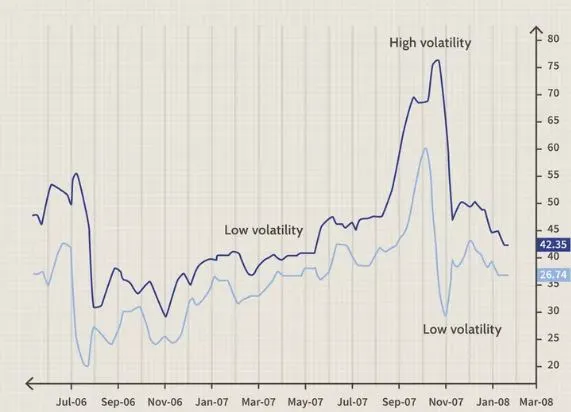
Price volatility is a fundamental aspect of trading. It reflects the rate at which prices change over a given period. The Average True Range plays a vital role in analyzing this volatility. High ATR values indicate high market volatility, signaling larger price swings. Conversely, low ATR values suggest lower volatility, indicating a more stable market environment.
Traders often use ATR to gauge the volatility of an asset before making trading decisions. For instance, a sudden spike in the Average True Range might indicate a potential market reversal or the beginning of a new trend. By monitoring these changes, traders can adjust their strategies to align with the current market conditions. This adjustment is crucial for reducing risk and maximizing potential returns.
Calculating the Average True Range

The calculation of the Average True Range is straightforward but essential for accurate analysis. It begins with determining the true range for each period. Once the true range is calculated, the next step is to average these values over the selected period, typically 14 days.
Here’s a breakdown of the steps:
- Calculate the true range: Identify the maximum of the following:
- Current high minus current low
- Current low minus previous close
- Current high minus previous close
- Average the true ranges over the specified period.
This method provides the initial ATR value. For subsequent periods, the following formula is used:
Current ATR = [(Prior ATR * 13) + Current True Range] / 14
This formula smooths out the ATR, making it a reliable indicator of ongoing price volatility. By continuously calculating the Average True Range, traders can track the evolving market conditions and adapt their strategies accordingly.
Interpreting the Average True Range
Interpreting the Average True Range is crucial for making informed trading decisions. When the ATR is expanding, it suggests increasing market volatility. This expansion could signal an opportunity for either a short sale or a long buy. However, since ATR is non-directional, traders must consider other indicators to confirm the market trend.
High ATR values typically occur during sharp price movements, whether up or down. These high values are often short-lived, reflecting the peak of market volatility. On the other hand, low ATR values indicate a period of consolidation, where prices remain within a narrow range. During such times, the market might be preparing for a significant move, either a reversal or a continuation of the existing trend.
Understanding these nuances allows traders to set more accurate entry and exit triggers. For example, a trader might use a multiple of the ATR, such as 1.5 times the ATR value, to set stop-loss levels. This approach helps in protecting profits during periods of high market volatility while avoiding premature exits during consolidation phases.
ATR as a Tool for Trading Strategy

Incorporating the Average True Range into a trading strategy can significantly enhance a trader’s ability to navigate market volatility. ATR provides insights into the potential risk and reward of a trade. For example, if a stock has a high ATR, it suggests that the stock is more volatile, and traders might expect larger price swings. In such cases, setting wider stop-loss levels can prevent premature exits due to normal market fluctuations.
Moreover, ATR can help traders decide whether a trade is worth pursuing. For instance, if the current market price is significantly above the ATR, it might indicate that the price has moved too far, too fast. This could signal an overbought condition, where a correction is likely. Conversely, if the price is well below the ATR, it might indicate an oversold condition, presenting a buying opportunity.
Traders also use ATR to adjust their position sizes. In high-volatility markets, where ATR values are elevated, traders might reduce their position sizes to manage risk better. Conversely, in low-volatility markets, where ATR values are lower, traders might increase their position sizes to capitalize on the stable price movements.
Historical ATR and Market Volatility Trends
Reviewing historical ATR values provides valuable context for current market conditions. By comparing the current ATR to its historical levels, traders can assess whether the market is experiencing unusual volatility. For instance, if the current ATR is significantly higher than its historical average, it could indicate that the market is undergoing a period of extraordinary volatility. This insight can help traders adjust their strategies to either capitalize on the increased volatility or protect against potential losses.
Moreover, historical ATR data can reveal patterns in market behavior. For example, a consistent pattern of rising ATR values over time might suggest a prolonged period of increasing market volatility. Conversely, a steady decline in ATR values might indicate a long-term trend towards market stabilization. Understanding these patterns can help traders anticipate future market movements and position themselves accordingly.
ATR and Entry and Exit Triggers
The Average True Range is invaluable for setting precise entry and exit triggers. By incorporating ATR into their trading strategies, traders can make more informed decisions about when to enter or exit a trade. For example, if the ATR is high, a trader might set wider stop-loss levels to accommodate the increased volatility. Conversely, in a low-volatility environment, tighter stop-loss levels might be more appropriate.
ATR can also be used to identify potential breakout opportunities. When the ATR begins to rise after a period of low volatility, it might signal that the market is preparing for a significant move. Traders can use this information to time their entries, potentially capturing the beginning of a new trend. Similarly, a declining ATR after a period of high volatility might indicate that the market is entering a consolidation phase, suggesting that it might be time to exit a position or tighten stop-loss levels.
Combining ATR with Other Indicators
While the Average True Range is a powerful tool, it is most effective when used in conjunction with other indicators. Combining ATR with trend indicators, such as moving averages or the Relative Strength Index (RSI), can provide a more comprehensive view of the market. For instance, if ATR is rising while the RSI is indicating an overbought condition, it might suggest that the market is about to reverse. Similarly, if ATR is low and a moving average crossover occurs, it could signal the beginning of a new trend.
Using multiple indicators helps traders confirm signals and make more accurate predictions. It reduces the likelihood of false signals, which can lead to premature exits or entries. By incorporating ATR into a broader trading strategy, traders can enhance their ability to navigate the complexities of the market.
Conclusion: Mastering Market Volatility with ATR
The Average True Range is a vital tool for traders seeking to master market volatility. By understanding and effectively using ATR, traders can gain insights into price volatility, set precise entry and exit triggers, and refine their overall trading strategies. Whether you are navigating a high-volatility market or a period of consolidation, the ATR provides the information needed to make confident market moves.
Harnessing the power of ATR allows traders to adapt to changing market conditions, protect their investments, and capitalize on opportunities as they arise. By integrating ATR into a well-rounded trading strategy, you can navigate the markets with greater confidence and success. Remember, while ATR is a powerful indicator, it is most effective when used alongside other tools and indicators, ensuring a comprehensive approach to trading in today’s dynamic markets.
Click here to read our latest article Geopolitical Risk Shockwaves: How Global Events Impact Forex