

Multi-time frame analysis, sometimes referred to as multiple time frame analysis, enables traders to concentrate on the timing of transactions and may assist in determining when trends may be nearing their conclusion. This article will describe how to apply this concept to the EUR/AUD currency pair.
MULTI-TIME FRAME ANALYSIS BENEFITS
Pitchforks and median-lines, as discussed in earlier articles, are used to identify important price response zones. To provide a more comprehensive picture of current market patterns, these same ideas may be extended to other time intervals.
The objective is to “see the forest through the trees,” or, in other words, to always have a more comprehensive understanding of where the market is in relation to trend before initiating a trade based on a certain setup. We can find potential entry opportunities inside a particular price increase or decrease and aid in timing these movements by looking at price behavior in different periods.
EURAUD DAILY
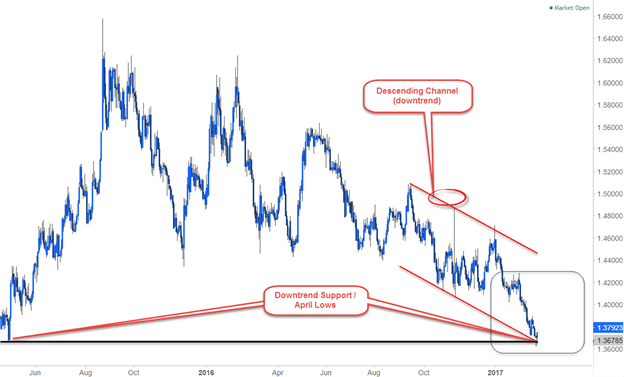
Take a look at the above daily EURAUD chart. A descending channel formation that highlighted support into the April lows at 1.3678 was present in the pair’s trading, which was clearly in a downturn from the 2015 highs. The intersection of trendlines with important price highs and lows will often signify more major places of support and resistance, as was covered in prior lectures. The attention now moves to the near-term picture for more clarity on how we would trade this potential comeback. In this case, price is challenging down-trend support.
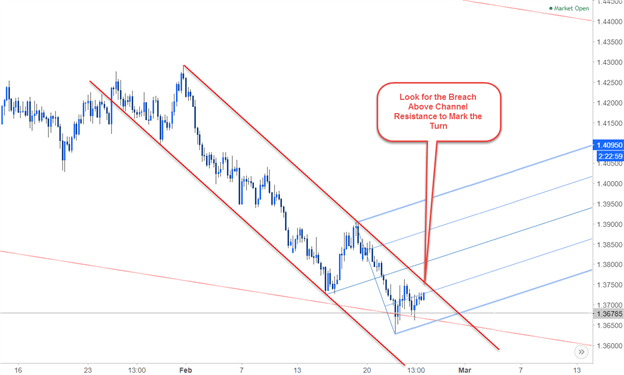
Price being at a support level does not automatically guarantee that it will hold. Before we consider looking to trade against the larger trend, prices must first demonstrate some kind of behavioral shift. When we look closely at the 4-hour chart, we can see an embedded short-term descending channel development (red). As price moves away from significant support, a break over channel resistance would shift the pair’s near-term emphasis upward and act as our “trigger” to enter a trade.
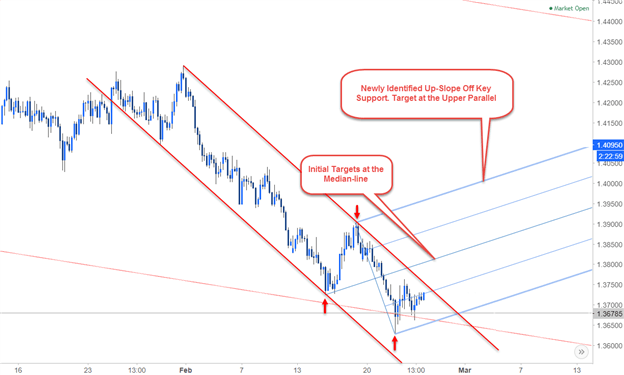
We may create an upslope using the most recent low-high-low and an ascending pitchfork formation to pinpoint our topside objectives. With a concentrate on the topside and while above the lower median-line parallel, the first aim of such a trade would be at the pattern’s median-line (bisector).
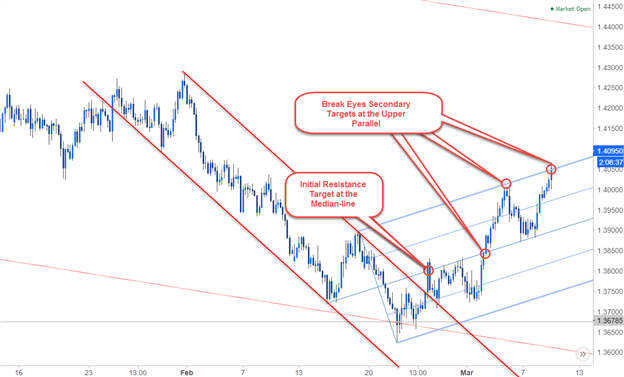
Several weeks later, the pair had in fact crossed over the down-channel resistance and had returned to test it as support (long-entry). Following a break and rally into the upper median-line parallel a few days later, the advance kept on into the median-line. This simple example demonstrates how looking at price movement through different time lenses may be useful for spotting trade opportunities within the framework of a bigger trend (also called primary trend). These patterns often include secondary (or even tertiary) trends that provide short-term setups for trading against the main trend.
KEY TAKEAWAYS FROM MULTI-TIME FRAME ANALYSIS
Some crucial considerations when using multi-time frame analysis
- A surplus of time frames is worthless. Some people attempt to time entrance and leave when all the time frames coincide with a signal, but this seldom happens.
- Use a ratio of 1:4 to 1:6 between the trigger and trend periods when reducing the number of timeframes. For instance, look at the daily chart for trend analysis if you are trading off the four-hour chart. Look at the four-hour for trend analysis if you’re searching for a trade-off from the one-hour.
- Recognize when you are trading against the trend – The near-term outlook often provides settings that go counter to the main trend, as in the case of the EURAUD example above. It’s crucial to handle these trades cautiously, which entails using less leverage and prudent stop losses.
With the use of multi-time frame research, traders can concentrate on picking the right moment to place trades and may also determine when a trend may be nearing its conclusion. No efforts would have been made on the long-side in the previous example if the EURAUD had remained within the boundaries of the creation of a near-term falling channel. In the same vein, we may have completely missed the turn if we hadn’t seen the trade in the context of the larger trend that was indicated on the daily chart. Always trade within the context of the main trend while keeping this in mind, and watch for short-term price action to provide time and price triggers.