
One of the most popular types of technical analysis is trendlines. However, are you sketching them properly? If not, allow me to demonstrate.
Many different types of technical analysis are used to study the markets. The application of support and resistance is, by far, the most typical.
Trend Lines: What Are They?
On a chart, a trend line is a line that is drawn between two levels to represent support or resistance, depending on the trend’s direction. The more often a price abides by a specific trend line, the more critical that trendline is.
Based on these trend lines, we can quickly identify possible pockets of higher supply and demand that may help the market go downward or upward.
How are trend lines drawn?
In my years of trading and instructing, I’ve seen a lot of misunderstandings about the precise location and placement of trend lines. In this area, there are two schools of thought:
- You may create a trendline by connecting the highs and lows of a particular candle.
or
- They may be deducted from the final price.
The key is to remain consistent in your approach, so you can either do one or the other.
Drawing a trendline from the highest closing price of one candle to the higher candle and trying to compel them to match the market is pointless. You’ll likely get some false trade signals as a result of this.
The direction of the trend, from where the price has been to where it is heading, should be considered while drawing trend lines.
Let’s examine the trend line in the chart below:
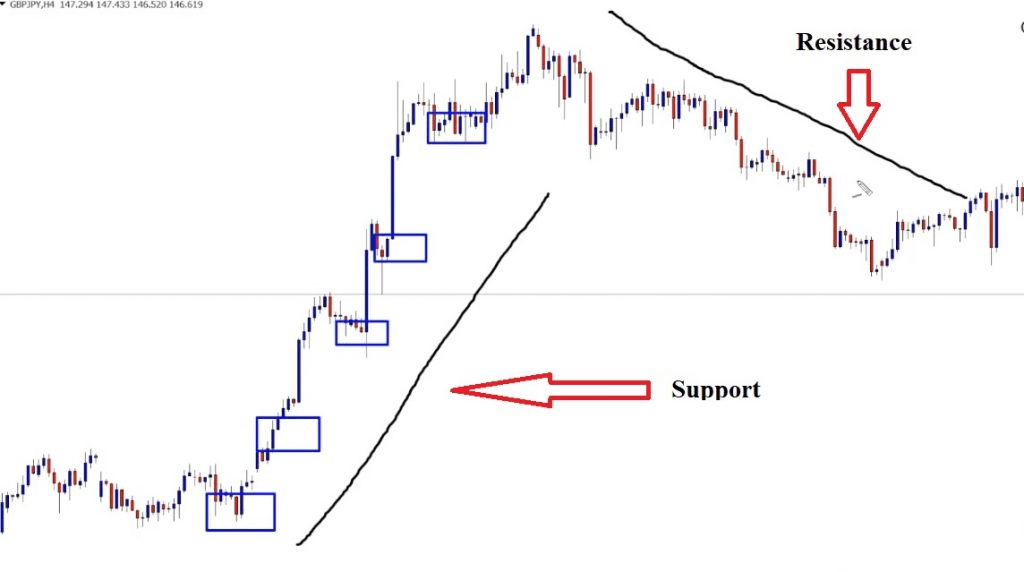
The trend line will be positioned below the price in an upward market, functioning as support.
The trendline will be located where the market price is in a downtrending market, functioning as resistance.
How should the trend line be placed?
One technique is to align the trend lines with the extreme highs and lows of a particular candle as measured by its wicks.
The price is now quite far from where that specific trendline is drawn, which is the only issue. The same holds if you are projecting a market that is declining.
The closing price method is the alternative strategy. Using the line graph, the price will trade much more closely to the trend line, which you can see on the candlesticks with ease.
How do you trade using trend lines?
First off, trendlines established on a long-term chart using the closing price are more accurate and dependable. It might be used on many kinds of charts and for a breakout.
Second, trend lines may be utilized to create dynamic support and resistance levels based on recent price movements. The support level will be the uptrend line, and the resistance level will be the downtrend line.
Price movement might either break through the trend line and create a reversal or bounce off the trend line and continue the trend.
The price won’t always bounce back precisely from the moving average since these trend lines are like regular support and resistance lines.
The next move should see prices move toward the break after the level of resistance or support has been breached. A fake breakout will occur if prices break and then fail to go forward quickly.
Trendlines may also be significant or minor, much as with support and resistance.
Summary:
- A line drawn between two levels on a chart to represent support or resistance is known as a trend line.
- The most trustworthy trend lines will always be produced at more significant periods.
- NEVER try to shoehorn trend lines into a market by drawing them.
- Trend lines may be used as dynamic levels of support and resistance.

I’m Vinit Makol, and I write to make sense of the markets, from forex and precious metals to the macro shifts that drive them. Here, I break down complex movements into clear, focused insights that help readers stay ahead, not just informed.