

Forex charts are essential tools for traders looking to navigate the dynamic world of currency trading. Whether you are a beginner or an experienced trader, understanding forex charts is crucial for making informed decisions. These charts visually represent market trends, helping traders identify price movements and potential opportunities. Without proper forex chart analysis, traders may struggle to predict market trends and make profitable trades.
To succeed in forex trading, you must understand how to read forex charts accurately. This guide will break down different chart types, essential technical indicators, and forex trading strategies to help you trade with confidence.
Types of Forex Charts

Forex charts come in different formats, each offering unique insights. The three main types are line charts, bar charts, and candlestick charts. Understanding these formats will enhance your forex chart analysis.
1. Line Charts
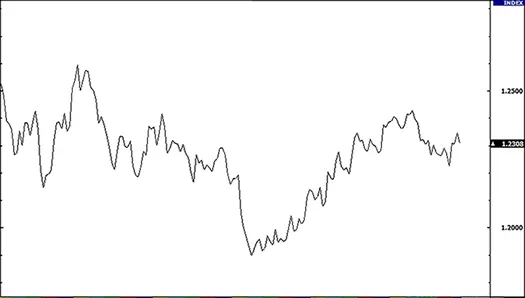
Line charts are the simplest form of forex charts. They connect closing prices over a specific time frame with a continuous line. These charts are ideal for beginners because they provide a clear overview of price trends.
Example: If the EUR/USD pair shows an upward line over several days, it indicates an uptrend. However, line charts lack detailed price information, making them less useful for short-term traders.
2. Bar Charts
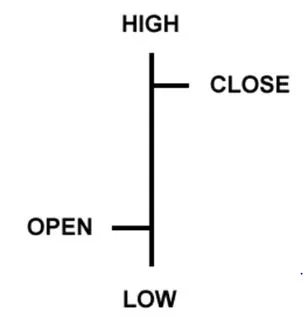
Bar charts provide more information than line charts. Each bar represents a single trading period, displaying the open, high, low, and close prices.
- The top of the bar shows the highest price reached.
- The bottom of the bar shows the lowest price reached.
- A small left tick represents the opening price.
- A small right tick represents the closing price.
Bar charts help traders identify trends, price volatility, and market sentiment more effectively than line charts.
3. Candlestick Charts
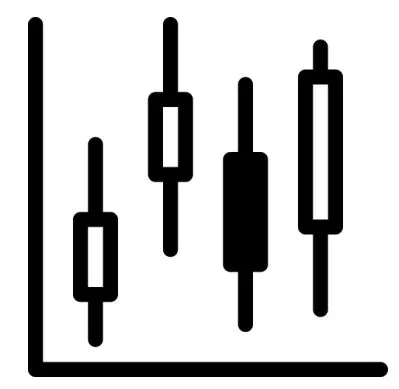
Candlestick charts are the most popular choice among traders. They display the same information as bar charts but in a visually appealing format.
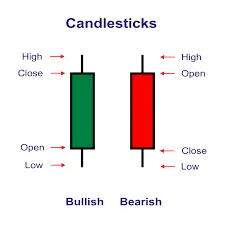
Each candlestick has a body and wicks:
- The body shows the difference between opening and closing prices.
- The wicks (shadows) represent the high and low prices.
- A green (or white) candle indicates a price increase.
- A red (or black) candle indicates a price decrease.
Understanding forex candlestick patterns is crucial for predicting price movements. Patterns like the hammer, engulfing pattern, and doji often signal trend reversals or continuations.
Key Components of Forex Charts
To read forex charts effectively, you must understand their key elements.
1. Currency Pairs
Each forex chart represents a currency pair, such as EUR/USD or GBP/JPY. The first currency is the base currency, while the second is the quote currency. The chart displays how much of the quote currency is needed to buy one unit of the base currency.
2. Time Frames
Forex charts can be analyzed over different time frames:
- Short-term (1-minute to 15-minute charts) – Ideal for scalping strategies.
- Medium-term (1-hour to 4-hour charts) – Suitable for day traders.
- Long-term (daily and weekly charts) – Best for swing and position traders.
Choosing the right time frame depends on your forex trading strategies.
3. Support and Resistance Levels
Support and resistance levels help traders identify potential entry and exit points.
- Support level: A price point where demand is strong enough to prevent further declines.
- Resistance level: A price point where selling pressure prevents further increases.
For example, if EUR/USD consistently bounces back from 1.1000, that level acts as support. If it struggles to break 1.1200, that level acts as resistance.
How to Identify Trends in Forex Charts

Understanding trends is a fundamental part of forex chart analysis. There are three main types of trends:
1. Uptrend (Bullish Trend)
An uptrend occurs when prices form higher highs and higher lows. Traders look for buying opportunities in an uptrend.
Example: If EUR/USD moves from 1.1000 to 1.1500, forming consecutive higher peaks and troughs, it signals an uptrend.
2. Downtrend (Bearish Trend)
A downtrend occurs when prices form lower highs and lower lows. Traders look for selling opportunities in a downtrend.
Example: If GBP/USD drops from 1.3500 to 1.3000, forming consecutive lower peaks and troughs, it signals a downtrend.
3. Sideways Trend (Range-bound Market)
A sideways trend occurs when prices fluctuate within a defined range. Traders use support and resistance levels to trade within this range.
Example: If USD/JPY moves between 145.00 and 147.00 without breaking either level, it indicates a range-bound market.
Essential Technical Indicators for Forex Chart Analysis
Technical indicators enhance forex chart analysis by providing additional insights into market conditions.
1. Moving Averages (MA)
Moving averages smooth price data to identify trends. The 50-day MA and 200-day MA are commonly used by traders.
Example: If the 50-day MA crosses above the 200-day MA, it signals a bullish trend.
2. Relative Strength Index (RSI)
RSI measures momentum and identifies overbought or oversold conditions.
- Above 70: The market is overbought (potential sell signal).
- Below 30: The market is oversold (potential buy signal).
3. Bollinger Bands
Bollinger Bands measure market volatility. When the bands widen, volatility increases. When they contract, volatility decreases.
4. MACD (Moving Average Convergence Divergence)
MACD helps traders identify momentum shifts. A MACD crossover can indicate a trend reversal.
Recognizing Forex Candlestick Patterns for Better Trades

Forex candlestick patterns provide valuable trading signals.
1. Bullish Candlestick Patterns
- Hammer: Signals a potential reversal after a downtrend.
- Engulfing Bullish: A large bullish candle engulfs the previous bearish candle.
2. Bearish Candlestick Patterns
- Shooting Star: Indicates a potential reversal after an uptrend.
- Engulfing Bearish: A large bearish candle engulfs the previous bullish candle.
Understanding these patterns improves forex trading strategies.
Avoid These Common Mistakes When Reading Forex Charts
Many traders make errors in forex chart analysis. Avoid these mistakes to improve your trading performance.
- Ignoring higher time frames – Always check longer time frames for a broader market perspective.
- Overusing indicators – Too many indicators can cause confusion. Stick to a few effective ones.
- Neglecting risk management – Always use stop-loss and take-profit orders.
- Trading based on emotions – Avoid impulsive decisions driven by fear or greed.
Conclusion
Reading forex charts is an essential skill for successful trading. Understanding different chart types, technical indicators, and forex candlestick patterns can improve your forex trading strategies. Traders who master forex chart analysis can identify market trends, make better decisions, and increase profitability.
With continuous learning and practice, you can enhance your trading skills and navigate the forex market with confidence. Start analyzing forex charts today and take your trading to the next level.
Click here to read our latest article How to Start Forex Trading with $100 or Less