

The shooting star candle is a common charting method used by many traders that uses Japanese candlesticks. This article will cover the shooting star reversal pattern in depth and how to use it to trade forex.
WHAT DOES A SHOOTING STAR CANDLESTICK PATTERN MEAN?
A single candle bearish reversal pattern known as a shooting star formation. It develops when a price is pushed higher and then immediately rejected lower, leaving a long wick to the upside in its wake. The candle’s long wick should occupy at least half of its overall length (see illustration below).
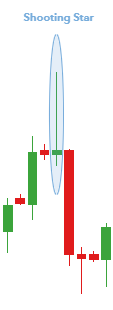
Additionally, the closing price must be close to the candle’s low point. As you can see, because prices were unable to maintain their higher trade, this results in an overall bearish structure.
The Inverted Hammer pattern exhibits a similar structure, but it corresponds to a bullish reversal signal rather than a bearish reversal signal. At a support level, pullback, or the bottom of a downtrend, this candlestick pattern is frequently visible.
The distinction between a shooting star formation on a forex pair, stock, or commodity is often questioned. The many forms of financial markets are identical to one another. No matter the equipment, a shooting star candlestick pattern will provide the same indication or signals.
PROS OF TECHNICAL ANALYSIS:
Due to its simplicity, this pattern is an excellent tool for technical traders who are just starting out. If traders follow the pattern description provided above, seeing a probable shooting star candle is simple.
Sometimes the candle pattern will be incorrect on its own. However, it might support the new negative bias if the pattern develops close to a resistance level or trend line. This is due to the fact that a single candle does not significantly affect the general trend or movement of the market.
When using this candlestick pattern, risk management must be taken into consideration. This gives the trader a “safety net” in case the market takes a bad turn.
The Shooting Star candlestick pattern has the following advantages:
- Simple to recognize
- When all requirements are satisfied, reasonable reliability
- Suitable for new traders, but not only them.
The Shooting Star candlestick pattern has some drawbacks.
- This candle does not always indicate a short position.
- Additional technical/fundamental confirmation is required
SHOOTING STAR PATTERN TRADING
Shooting Star Candlestick Pattern for the EUR/USD:
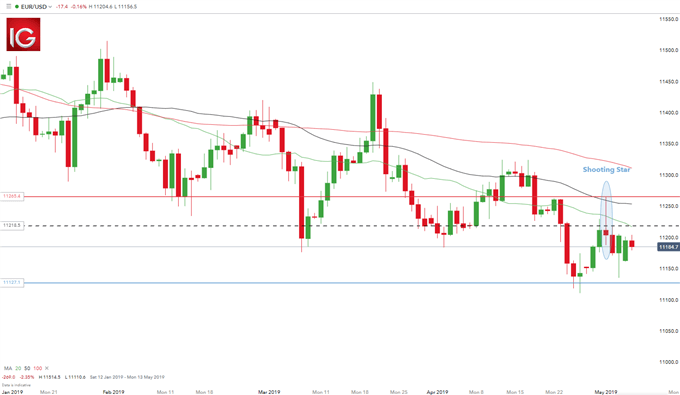
It is not too difficult to trade this reversal pattern. First, since lower prices are implied, we should search for opportunities to short. We’ll try to set the stop loss at the most recent swing high because the prices were previously rejected at the shooting star’s high (red horizontal line on the chart).
Trading the retest of the wick would allow a trader to capture a better risk-to-reward ratio than simply entering on the open of the subsequent candle (black dashed line). Retests of the wick frequently take place when it is longer than usual.
Prices frequently reverse course and retrace an upward portion of the long wick. Recognizing this, a trader might postpone entry until the middle of the wick as opposed to entering right after the shooting star candle forms. This indicates that the trader is starting a short position at a higher price and with a more restrictive stop loss, which lowers risk. The stop loss will not change regardless of the entering method.