
Fibonacci retracement is a crucial tool in forex trading. It helps traders identify key levels where price might reverse or continue its trend. Many traders rely on it as part of their forex trading strategy. By understanding Fibonacci levels, traders can make better decisions and improve their market timing.
This article explains Fibonacci retracement in detail. You will learn how to use it effectively, apply it to your forex trading strategy, and avoid common mistakes. Whether you are a beginner or an experienced trader, this guide will help you enhance your technical analysis skills.
What is Fibonacci Retracement?

Fibonacci retracement is a technical analysis tool that traders use to find potential support and resistance levels. It is based on the Fibonacci sequence, a series of numbers where each number is the sum of the two preceding ones. The key Fibonacci levels used in forex trading are:
- 23.6%
- 38.2%
- 50%
- 61.8%
- 78.6%
These levels represent possible areas where the price may retrace before continuing in the original trend. Many traders use these levels to find entry points, set stop-loss orders, and determine take-profit targets.
How to Draw Fibonacci Retracement on a Chart
To use this, traders must first identify a significant price movement. This movement can be either an uptrend or a downtrend.
Steps to Draw Fibonacci Retracement
- Identify the swing high and swing low in the market.
- In an uptrend, the swing low is the starting point, and the swing high is the end.
- In a downtrend, the swing high is the starting point, and the swing low is the end.
- Select the Fibonacci retracement tool on your trading platform.
- Apply the tool from the swing high to the swing low (for a downtrend) or from the swing low to the swing high (for an uptrend).
- Observe the Fibonacci levels and how the price reacts at each level.
The most important levels to watch are 38.2%, 50%, and 61.8%. These often act as strong support and resistance zones.
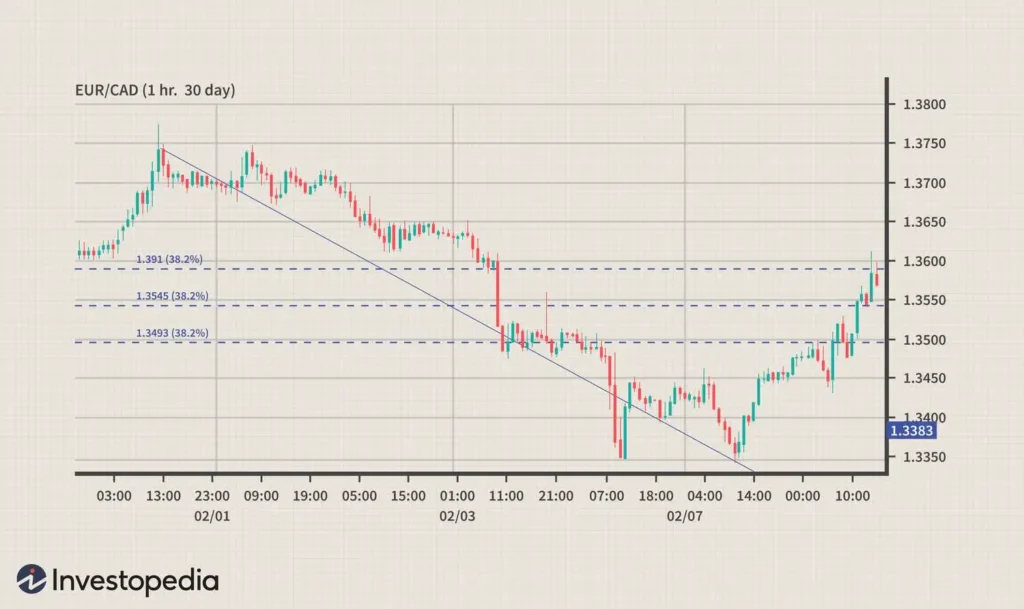
The image above illustrates Fibonacci retracement levels applied to a downtrend in the EUR/CAD forex pair. The chart shows a clear price decline, followed by a retracement to key Fibonacci levels. The 38.2% retracement level is highlighted multiple times, indicating potential resistance zones where the price may reverse before continuing its downward trend.
Traders use these levels to identify possible entry points, stop-loss placements, and take-profit targets. This visual representation helps in understanding how Fibonacci retracement works in real-market conditions, making it a valuable tool for technical analysis.
Using Fibonacci Retracement to Find Trade Entries

Many traders use Fibonacci retracement to find trade entry points. The price does not move in a straight line; instead, it retraces before continuing in the main direction.
Example of Trade Entry
- If the market is in an uptrend, traders look for buying opportunities when the price retraces to a Fibonacci support level.
- If the market is in a downtrend, traders look for selling opportunities when the price retraces to a Fibonacci resistance level.
A trader might wait for a bullish candlestick pattern to confirm an entry at a Fibonacci support level in an uptrend. In a downtrend, a bearish pattern at a Fibonacci resistance level could signal a selling opportunity.
How to Use Fibonacci Retracement for Stop-Loss and Take-Profit
Setting stop-loss and take-profit levels is crucial in forex trading. This tool helps traders define risk and reward clearly.
- A stop-loss is placed slightly beyond the nearest Fibonacci level to protect against sudden price movements.
- A take-profit target is often set at the next Fibonacci extension level or the previous price high/low.
For example, in an uptrend, if the price retraces to the 61.8% Fibonacci level, a trader might place a stop-loss just below the 78.6% level. The take-profit target could be the recent swing high or the 127.2% Fibonacci extension.
Combining Fibonacci Retracement with Other Technical Tools

Fibonacci retracement works best when combined with other technical indicators. This increases the accuracy of trade setups.
1. Support and Resistance
If a Fibonacci level aligns with a strong support and resistance zone, it becomes a more reliable area for price reaction.
2. Trendlines
When a Fibonacci level coincides with a trendline, it adds extra confirmation for a trade entry.
3. Moving Averages
Traders often use the 50-day and 200-day moving averages along with Fibonacci retracement. If a moving average aligns with a Fibonacci level, it strengthens the setup.
4. Candlestick Patterns
Watching for bullish engulfing, bearish engulfing, or doji candles at Fibonacci levels can confirm trade entries.
Common Fibonacci Retracement Trading Strategies
1. Trend Trading
This strategy follows the main trend and looks for retracement points to enter trades.
How It Works:
- Identify a strong trend (uptrend or downtrend).
- Apply Fibonacci retracement to the recent price movement.
- Enter a trade when the price retraces to a key Fibonacci level and shows a reversal signal.
- Set a stop-loss slightly beyond the retracement level.
- Set a take-profit at the previous high or a Fibonacci extension level.
2. Fibonacci Retracement with Breakout Trading
This strategy identifies potential breakout levels based on Fibonacci retracement.
How It Works:
- Find a range or consolidation zone in the market.
- Apply the tool to the previous price movement.
- Wait for the price to break above or below a key Fibonacci level.
- Enter a trade once the breakout is confirmed with strong price action.
- Use Fibonacci extensions for profit targets.
Mistakes to Avoid When Using Fibonacci Retracement
Many traders misuse it by applying it incorrectly. Avoid these mistakes:
1. Applying Fibonacci on Small Price Movements
Using it on minor price swings can result in unreliable levels. Always use it on significant trends.
2. Ignoring Market Conditions
If the market is moving sideways, this tool may not provide accurate signals. It works best in trending markets.
3. Using Fibonacci Retracement Alone
Relying only on Fibonacci levels can lead to false signals. Always combine it with other technical indicators for confirmation.
4. Not Waiting for Confirmation
Entering a trade immediately at a Fibonacci level without confirmation is risky. Wait for candlestick patterns or other indicators to validate the setup.
Conclusion
Fibonacci retracement is a powerful tool in forex trading. It helps traders identify potential support and resistance levels, improving trade entries and exits. When used correctly, it enhances a forex trading strategy and increases the chances of success.
However, it should not be used in isolation. Combining Fibonacci levels with trendlines, support and resistance, moving averages, and candlestick patterns can improve accuracy. Traders should always practice on a demo account before using Fibonacci retracement in live trading.
By mastering this tool, traders can make more informed decisions and increase their profitability in the forex market.
Click here to read our latest article Forex Ponzi Scheme or Real Market? What Traders Need to Know