

Fibonacci Retracements are a powerful tool in technical analysis that traders use to predict future price movements. By understanding Fibonacci levels, traders can identify potential support and resistance areas in the market. These levels are based on the Fibonacci sequence, a series of numbers closely associated with the golden ratio. This sequence and ratio appear frequently in nature and, as many traders believe, in the financial markets as well.
The concept of Fibonacci Retracements involves taking two extreme points on a chart, typically a peak and a trough, and dividing the vertical distance by key Fibonacci levels. The most commonly used Fibonacci levels are 23.6%, 38.2%, 50%, 61.8%, and 100%. These levels can help traders predict where the price might retrace to before resuming its original trend.
Understanding the Fibonacci Sequence and Golden Ratio

Leonardo Fibonacci introduced the world to the Fibonacci sequence in the 12th century. This sequence begins with 0 and 1, and each subsequent number is the sum of the previous two. For example, the sequence starts as 0, 1, 1, 2, 3, 5, 8, 13, and so on. As this sequence progresses, the ratio between any two consecutive numbers approaches 1.618, known as the golden ratio.
This golden ratio is significant in many aspects of life, including art, architecture, and nature. For example, the ratio of a person’s forearm to their hand is approximately 1.618. In the financial markets, this ratio is translated into Fibonacci levels, which traders use to identify potential points of support and resistance.
Applying Fibonacci Retracements in Technical Analysis
Fibonacci Retracements are crucial in technical analysis because they help traders identify potential reversal points in the market. When the price of an asset moves in a certain direction, it does not usually move in a straight line. Instead, it tends to retrace or pull back before continuing in the original direction. Fibonacci levels help traders predict where these pullbacks might occur.
To apply Fibonacci Retracements, traders need to identify a significant peak and trough on a price chart. Once these points are established, they draw horizontal lines at the key Fibonacci levels: 23.6%, 38.2%, 50%, 61.8%, and 100%. These lines represent potential levels of support and resistance.
For instance, if an asset’s price rises from $100 to $150 and then starts to fall, a Fibonacci Retracement could predict that the price might find support at the 38.2% level, which in this case would be around $130. If the price continues to fall and breaks this level, the next potential support could be at the 50% level, around $125. If it falls further, the 61.8% level, approximately $120, could be the next support level.
The Importance of Support and Resistance in Trading

Support and resistance levels are fundamental concepts in technical analysis. Support refers to a price level where a downtrend can be expected to pause due to a concentration of demand. Resistance, on the other hand, is a price level where a trend may pause or reverse due to a concentration of selling interest.
Fibonacci Retracements help traders identify these critical support and resistance levels. When a price approaches a Fibonacci level, it often encounters resistance if the trend is upward or support if the trend is downward. These levels can be pivotal in making trading decisions. For example, if a price approaches a Fibonacci level and then bounces back, this could be a signal to enter a trade in the direction of the trend.
On the other hand, if the price breaks through a Fibonacci level, it may signal that the trend is continuing, and traders might consider holding onto their positions. Understanding and utilizing these support and resistance levels through Fibonacci Retracements can significantly enhance a trader’s ability to make smarter trading decisions.
Combining Fibonacci Retracements with Other Technical Indicators
While Fibonacci Retracements are a powerful tool on their own, they become even more effective when combined with other technical indicators. Traders often use Fibonacci levels in conjunction with indicators like the Moving Average Convergence Divergence (MACD), relative strength index (RSI), or stochastic oscillators to confirm potential reversal points.
For example, if the price of an asset retraces to a 38.2% Fibonacci level and the MACD indicator shows a bullish crossover, this might signal a strong buying opportunity. Conversely, if the price retraces to a 61.8% Fibonacci level and the RSI indicates that the asset is overbought, this could be a signal to sell.
Using multiple indicators alongside Fibonacci Retracements allows traders to filter out false signals and increase the accuracy of their predictions. This approach can help in identifying high-probability trade setups and improving overall trading performance.
Fibonacci Retracements in Different Timeframes

Fibonacci Retracements can be applied across different timeframes, making them a versatile tool for both short-term traders and long-term investors. However, the effectiveness of Fibonacci levels can vary depending on the timeframe used. Generally, Fibonacci levels on longer timeframes, such as daily or weekly charts, tend to be more reliable than those on shorter timeframes, like 5-minute or 15-minute charts.
For long-term investors, Fibonacci levels can help identify key support and resistance levels over weeks or months. This can be particularly useful when planning entry and exit points for long-term positions. On the other hand, day traders might use Fibonacci levels to identify intraday support and resistance levels, allowing them to capitalize on short-term price movements.
Regardless of the timeframe, it is essential to remember that Fibonacci Retracements should not be used in isolation. Combining them with other forms of technical analysis and considering the overall market context can provide a more comprehensive view of potential trading opportunities.
Real-World Examples of Fibonacci Retracements
To illustrate the power of Fibonacci Retracements, let’s look at a real-world example. Consider the price movement of Crude Oil West Texas (WTI Crude Oil) in the commodities market. The price of WTI Crude Oil experienced a significant rally, followed by a pullback. Traders applied Fibonacci Retracements to this pullback to identify potential support levels.
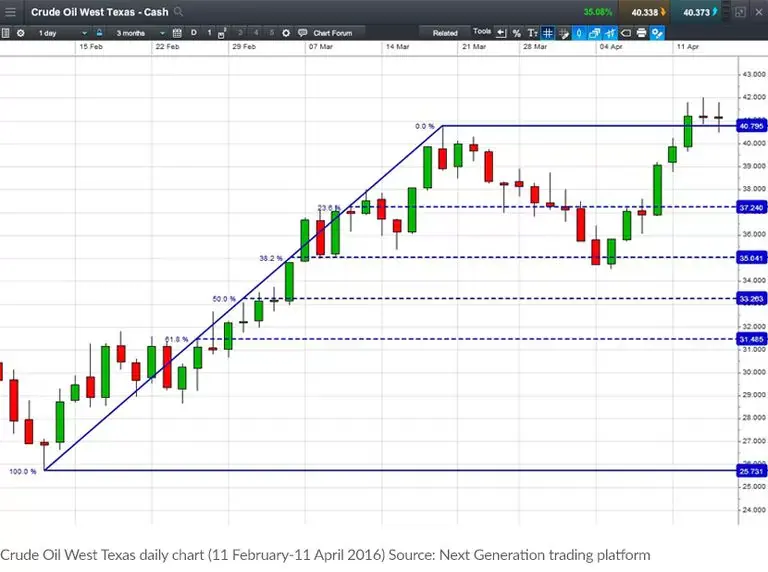
As the price fell, it approached the 38.2% Fibonacci level, which acted as a support level. The price briefly dipped below this level but quickly rebounded, confirming the 38.2% level as a strong support. The market then resumed its upward trend, eventually reaching new highs.
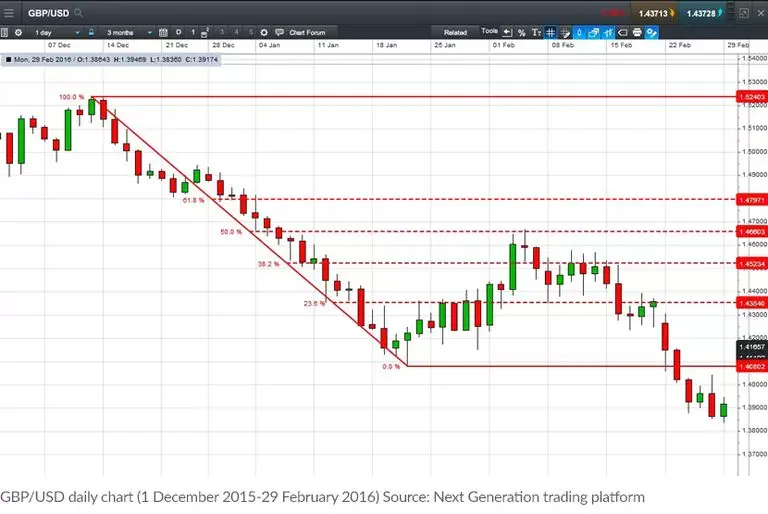
In another example, let’s consider the GBP/USD currency pair. The pair experienced a sharp decline, falling from the 1.5200 area to around 1.4100. As the price stabilized, traders applied Fibonacci Retracements to the downtrend. The price retraced to the 50% Fibonacci level before resuming its decline, demonstrating the predictive power of Fibonacci Retracements in identifying resistance levels.
Best Practices for Using Fibonacci Retracements
To maximize the effectiveness of Fibonacci Retracements, traders should follow some best practices. First, always use Fibonacci levels in conjunction with other technical analysis tools. Relying solely on Fibonacci levels can lead to false signals, so it is crucial to confirm potential reversal points with other indicators.
Second, consider the overall market trend. Fibonacci Retracements are most effective when used within the context of a clear trend. In a strong uptrend, focus on using Fibonacci levels to identify potential support areas for buying opportunities. In a downtrend, use Fibonacci levels to identify resistance areas for potential short-selling opportunities.
Third, be mindful of the timeframe you are using. Fibonacci levels on longer timeframes tend to be more reliable than those on shorter timeframes. Always consider the context of the trade and adjust your strategy accordingly.
Lastly, practice risk management. Even with the predictive power of Fibonacci Retracements, no trading strategy is foolproof. Always use stop-loss orders to protect your capital and limit potential losses.
Conclusion
Fibonacci Retracements offer traders a valuable tool for predicting potential reversal points in the market. By understanding and applying Fibonacci levels, traders can identify critical support and resistance levels, allowing them to make more informed trading decisions. When combined with other technical analysis tools, Fibonacci Retracements can significantly enhance a trader’s ability to capitalize on market movements.
Whether you are a short-term trader or a long-term investor, Fibonacci Retracements can be a key component of your trading strategy. By leveraging these levels, you can gain deeper insights into market trends and improve your overall trading performance. Remember to use Fibonacci Retracements as part of a broader trading plan, and always consider the importance of risk management in your trading endeavors.
Click here to read our latest article Harness Average True Range for Confident Market Moves