ANALYSIS OF GOLD (XAU/USD)
- In the wake of the Fed’s aggressive rate expectations, gold entered the oversold territory.
- The pre-invasion level of 1611 is still within reach as the precious metal continues to be burdened by fundamentals.
AFTER HAWKISH FED FORECASTS, GOLD ENTERED OVERSOLD LEVELS
Except for the Bank of Japan, global central banks are increasingly adopting the contractionary monetary policy, which negatively affects gold. The market had to catch up with the Fed’s most recent summary of economic prospects because Fed members were more pessimistic than anticipated. This was especially true of the dot plot, which projects the Fed funds rate over time.
Fed funds futures implied probability predicted that the Fed would raise rates by over 4% initially, but that rate cuts would soon follow. The market reacted when the Fed’s dot plot showed a unanimous desire for rates to finish 2023 higher than 2022. This implied that rates would stay higher for longer. Since the day of the FOMC meeting, the dollar (DXY) has increased by around 4.6 points (4.19%), putting more pressure on the precious metal when other global commodities continue to decline.
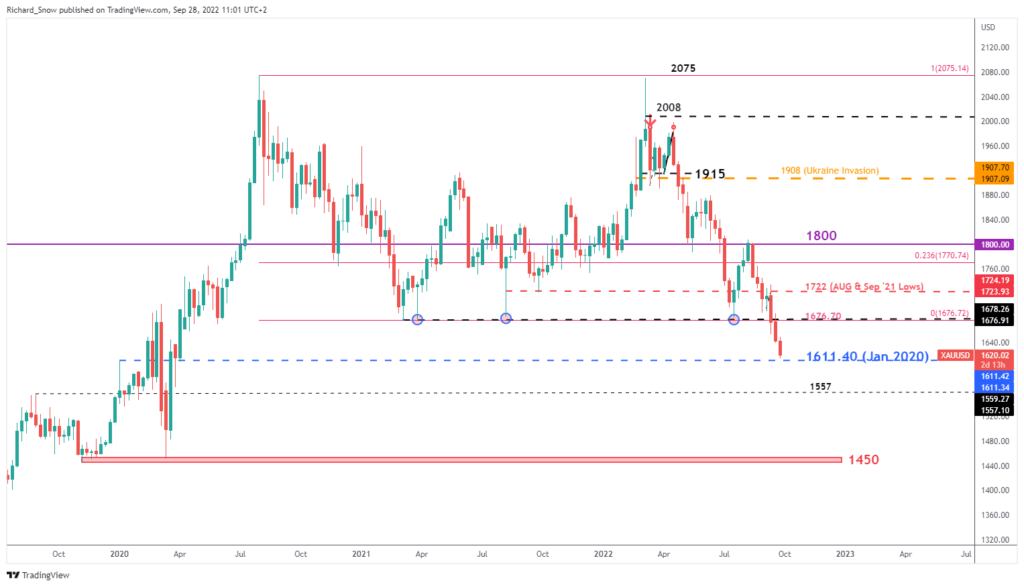
The weekly gold chart demonstrates the yellow metal’s fragility since it crossed the crucial 1776 level. The rings on the chart show many instances when 1776 held efforts to trade lower. The level also signified the complete retracement of the significant rise from 2021 to 2022.
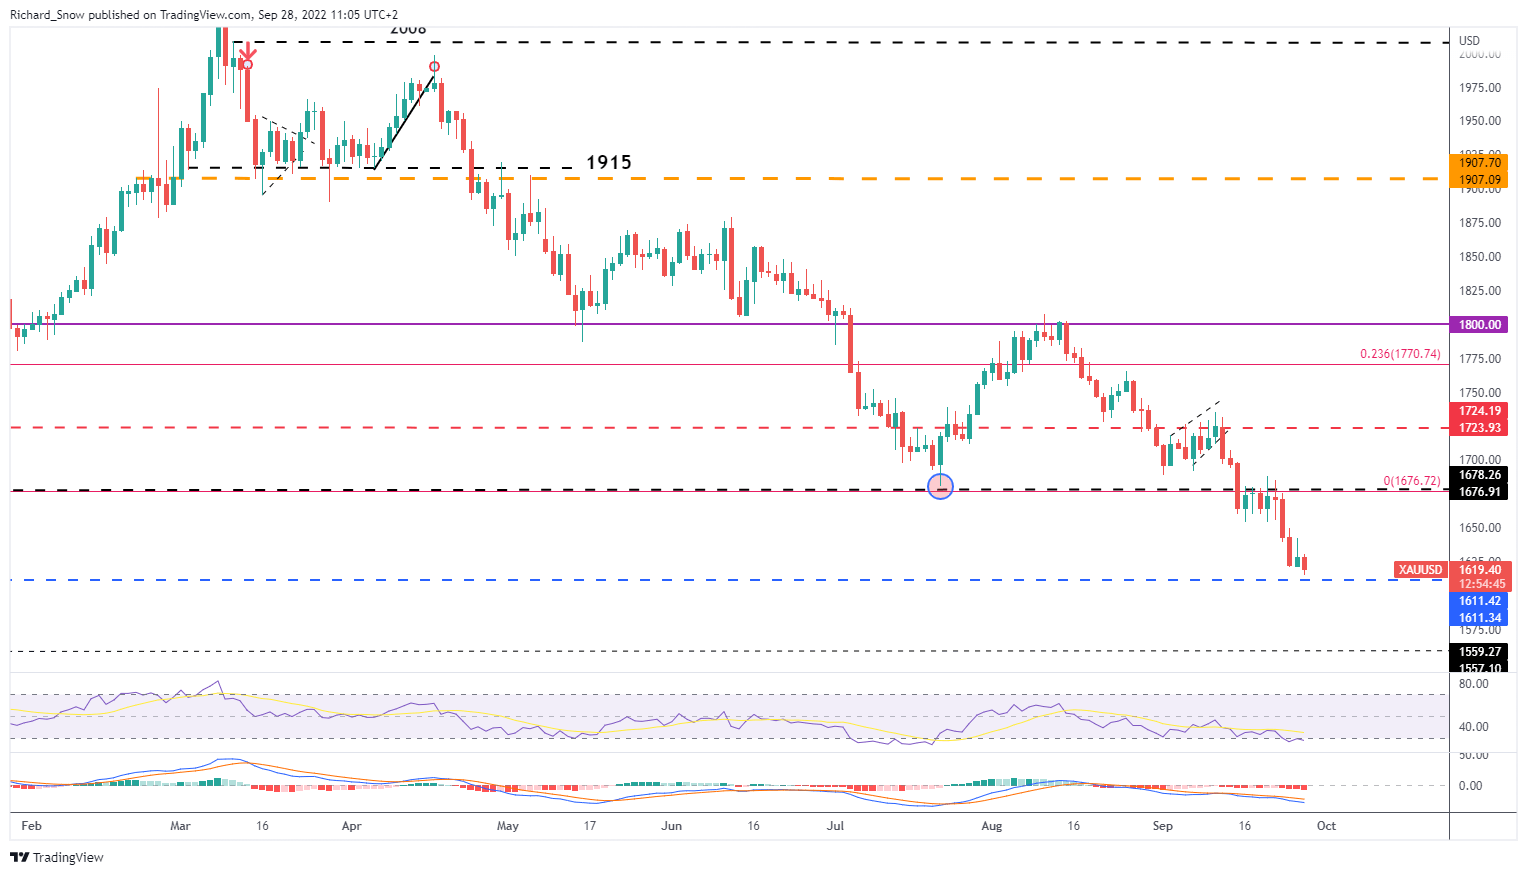
The pre-invasion level of support at 1611, which corresponds to January of the current year, is the level of importance after that. The daily chart reveals that gold has now entered the oversold area on the RSI, although it must be emphasized that markets may stay in oversold territory for a long time. Only until recovery from oversold circumstances, at which time 1676 reemerges as resistance, can any indication of a retracement be taken seriously.
Gold (XAU/USD) Weekly Chart
Since failing to break above the 1800 level, the beginning of this current leg down, the daily chart indicates the essential character of the present downtrend. Strong moving markets often have pullbacks that are pretty small and transient. The daily chart shows several weak pullbacks that were quickly followed by sharp sell-offs, indicating that the sellers aren’t yet finished.
Gold (XAU/USD) Daily Chart