Tag: trading

  • 4 Global Market Updates- 9 January, 2023

    4 Global Market Updates- 9 January, 2023

    In this article, we have covered the highlights of global market news about the AUD/USD, GBP/USD, USD/JPY and EUR/USD.

    AUD/USD: Look for more gains now around 0.6950 – UOB

    The AUD/USD pair may rise to the 0.6950 area in the following weeks due to the persistent bullish bias, according to UOB Group economists Lee Sue Ann and Quek Ser Leang.

    24-hour view: “We anticipated a decline in the Australian dollar last Friday, but we thought it was unlikely it would test the support level of 0.6700. The Australian dollar then temporarily fell to 0.6722 before rapidly rising to a high of 0.6886. AUD may increase to 0.6920 in the future. The next barrier at 0.6950 is unlikely to be challenged due to the overbought circumstances. Support may be found at 0.6820, then 0.6850.

    Within the next three weeks: “In our most recent narrative from last Thursday (05 January, spot at 0.6825), we emphasized that rising momentum has slowed, and we anticipated AUD to trade within a wide consolidation band of 0.6660/0.6860. We were unprepared for the significant increase on Friday when the AUD reached a high of 0.6886. The upward trend has resumed, and we anticipate more AUD growth. Within the next several days, AUD must continue to trade above 0.6775 to maintain the momentum. There is resistance at 0.6950.

    GBP/USD: The current objective is 1.2270 – UOB

    Markets Strategist Quek Ser Leang and Economist Lee Sue Ann of UOB Group believe that the short-term upside potential of GBP/USD might retarget the 1.2270 regions.

    usd

    “We emphasised last Friday that ‘there is an opportunity for the decline in GBP to continue to 1.1850 before stabilization is probable,’” the 24-hour outlook reads. Following that, the British pound fell to a low of 1.1846 before surging to 1.2100. Early Asian trading saw GBP extend its rally, and even if the barrier around 1.2200 is probably out of reach today, it may still increase (there is another resistance at 1.2160). Any decline is unlikely to test the support at 1.2010 (minor support is at 1.2060) on the downside.

    Within the next three weeks: “Our prediction of ‘more GBP weakening’ from last Friday (06 January, spot at 1.1915) was swiftly disproved as it blasted beyond our strong resistance’ of 1.2020. (high of 1.2100). Although the quick increase is getting ahead of itself, GBP may climb much higher; nevertheless, it is unclear whether it will have enough momentum to hit 1.2270. On the downside, a break of 1.1950 would signal that the pound is not gaining further ground.

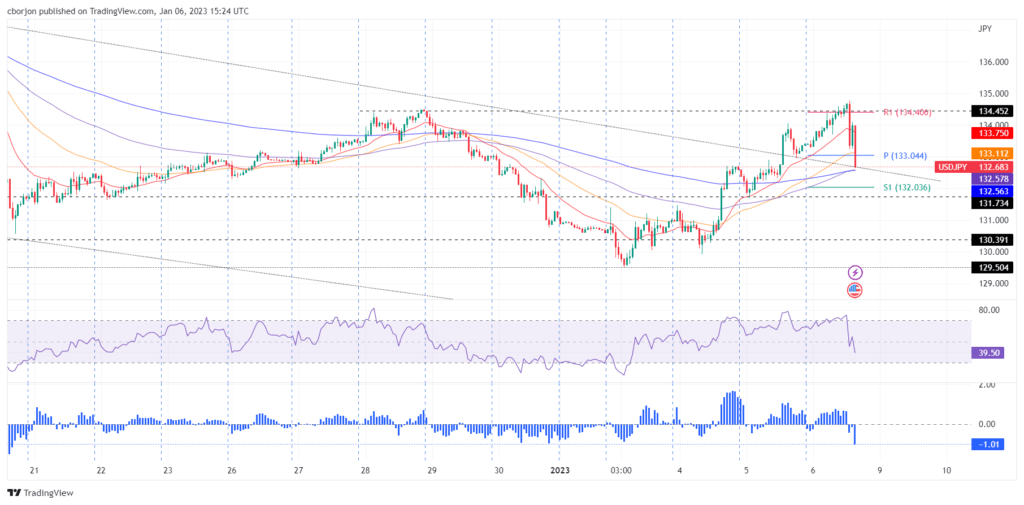
    USD/JPY is caught in a range below the 132.00 level and fails to find a clear direction.

    On the opening day of a new week, the USD/JPY pair finds it challenging to generate real momentum and oscillates between modest gains and losses during the early European session. The pair is now trading close below round 132.00 and is susceptible to continuing Friday’s decline after a one-week peak.

    The US Dollar adds to Friday’s losses caused by worse US macroeconomic data, which is considered a significant obstacle for the USD/JPY pair. According to the frequently regarded US monthly employment report (NFP), average hourly earnings increased by 0.3% in December, bringing the YoY increase down to 4.6% from 4.8% in November. This was seen as a sign that inflationary pressures could be easing.

    Additionally, the US ISM Services PMI entered contraction territory and reached its lowest point since 2009, raising hopes for a more gradual tightening of monetary policy by the Fed. This causes the decline in US Treasury bond rates to continue, which hurts the dollar’s value. However, the risk-on urge weakens the Japanese Yen, a haven currency, and boosts the USD/JPY pair.

    Investor confidence has increased due to China’s most significant shift away from its stringent zero-COVID policy, as seen by the upbeat mood on the equities markets. The recent euphoria, however, is likely to be short-lived due to worries about a deeper global economic slowdown and worries that the enormous influx of Chinese tourists may lead to another spike in COVID infections.

    EUR/USD Price Analysis: The recovery of 50% Fibo extends towards 1.0700.

    As it advanced toward 1.0700 on Monday morning and was up 0.30% intraday around 1.0680 at press time, EUR/USD maintains its positive bias sparked by the US NFP report.

    usd

    As a result, the important currency pair continues the previous day’s U-turn from a 50% Fibonacci retracement level of the downside of the February–September 2022 period to approach a one–month–old resistance line, which is close to the 1.0700 at the time of press.

    It’s important to point out that the bulls are also aided by the EUR/USD pair’s successful trading above the 50-DMA and the MACD’s recent lessening of its negative bias.

    The “Golden Ratio,” a 61.8% Fibonacci retracement level at 1.0745, which comes before the 1.0786 top in May 2022, poses a challenge to the EUR/USD bulls.

    Round number 1.0800 may serve as the EUR/USD bears’ last line of defense before the quotation is directed toward the late-April 2022 high, around 1.0935.

    On the other hand, a trend line with a rising slope from early November 2022, close to 1.0560 at the latest, prevents a short-term decline in the EUR/USD.

    Please click here for the Market News Updates from 6 January, 2023.

  • Gold (XAU/USD) Hits $1,850 Support Retains Against Earlier Resistance.

    Gold (XAU/USD) Hits $1,850 Support Retains Against Earlier Resistance.

    The technical outlook for gold (XAU/USD): Bullish over $1,850

    Prices of gold recovered after overcoming a significant technical obstacle. Bulls in the XAU/USD market aim for Fibonacci resistance from the last advance of over $1,880. For the time being, psychological support and resistance help to influence price activity.

    (XAU) rises on dollar uncertainty; can bulls reach $1,880?

    After pushing prices back above $1,850, gold prices concluded the week, holding onto an expected 2.6% increase. Economic data added to the pressure on the precious metal as fundamentals continued to influence sentiment.

    Prices increased after the XAU/USD saw an astounding 15% comeback from the November low ($1618.3) as the market was bullish to start the new year.

    However, the publication of the December FOMC minutes and encouraging job statistics gave the Dollar some short-term reprieve after it hit a high of $1871.3 on Wednesday. Before the release of US non-farm payrolls, commodities prices continued to move carefully. The yellow metal prices hit a weekly low of $1829.9 before soaring upward.

    XAU/USD Daily Chart for Gold

    gold
    Source: DailyFX

    A breach of $1880 might pave the way for a retest of $1900 as bulls get ready to take on the next significant hurdle of resistance at the weekly high of $1875. The weekly chart shows how these levels served as resistance and support during the last two years, but the Dollar will likely play a role in whether bullish or bearish momentum develops.

    XAU/USD Weekly Chart for Gold

    gold
    Source: DailyFX

    Gold’s Technical Levels (XAU/USD)

    SUPPORTRESISTANCE
    S1: $1,850 – $1,848.6R1: $1,875 (weekly high)
    S2: $1,829.9 (weekly low)R2: $1,880 (psychological level)
    S3: $1,800R3: $1,900

  • USD/JPY falls below 133.00 on US Dollar weakening and NFP data

    USD/JPY falls below 133.00 on US Dollar weakening and NFP data

    Price analysis for the USD/JPY: Likely to be strongly bearish below 133.00. Despite the tight labor market, the US Nonfarm Payrolls statistics for December reduced the value of the US dollar. The softening of the average hourly wage led to expectations that the Federal Reserve would act dovish during its meeting in February. The US economic statistics, although good, put pressure on the US Dollar, causing the USD/JPY to battle at the 200-day Exponential Moving Average (EMA) around 134.82 and fall below the 134.00 level. This contributed to a loss of 100 pip in the major. The USD/JPY is now trading at 132.81, down from its initial price by 0.44%.

    According to figures released by the US Department of Labor on Friday, Nonfarm Payrolls climbed by 223K in December, above predictions of 200K. While average hourly wages increased 4.6%, below the market forecast of 5.0%, the unemployment rate decreased to 3.5% YoY, which pleased Fed policymakers who saw wage pressures as a barrier to combating inflation.

    jpy

    “Revisions to average hourly earnings statistics portray a little less gloomy picture for the Fed on wages than the Nov report,” The Wall Street Journal (WSJ) Fed Watcher Nick Timiraos tweeted.

    In response to the Timiraous Tweet, the US Dollar Index, which gauges the dollar’s value against a group of competitors, fell to 104.963, below the 105.000 thresholds. However, it gained some ground before reversing course and turning negative at around 104.682, down by 0.46%.

    The USD/JPY is falling from daily highs achieved at 134.77 as US Treasury note rates decreased by nine basis points to end at 3.625%.

    Raphael Bostic, president of the Fed in Atlanta, has recently been making headlines. He said that the December labor market statistics did not alter his assessment of the economy and that the Fed should continue on its current trajectory since inflation is still too high. The Federal Funds Rate (FFR) is expected to reach and remain in the 5.00–5.25% range until the end of 2024, according to Bostic’s base scenario.

    Price analysis for the USD/JPY: Technical Prospects

    The USD/JPY hourly chart shows that the US Dollar is still losing ground in the near term, extending its advances below the daily pivot point at 133.04. The USD/JPY broke through the 20 and 50-EMAs on its way down, but a downslope trendline and the intersection of the 100 and 200-EMAs around 132.55/57, just below the S1 daily pivot at 132.03, may stop the decline. On the other hand, if the USD/JPY manages to retake 133.00, it would pave the way for a continuation of the uptrend, exposing resistance levels like the 134.00 level and the R1 daily pivot point at 134.45.

    jpy
    Source: FX Street
  • 4 Global Market Updates- 6 January, 2023

    4 Global Market Updates- 6 January, 2023

    In this article, we have covered the highlights of global market news about the USD/CNH, USD/JPY, EUR/USD and AUD/USD.

    USD/CNH: Solid support is aligned around 6.8400 – UOB

    For the time being, more losses in USD/CNH shouldn’t be ruled out, according to UOB Group economists Lee Sue Ann and Quek Ser Leang.

    24-hour perspective: “Yesterday, we said that the US Dollar is expected to move lower but is unlikely to breach the support at 6.8700. Our prediction came true as the US Dollar fell to a low of 6.8714 before rising. Although the US Dollar may go below 6.8700 today, the next support, around 6.8560, is unlikely to be in sight. The underlying tone still seems weak. A violation of 6.9000 (a minor resistance level at 6.8900) would signal an easing of the slight downward pressure now present.

    Within the next three weeks: “We don’t have anything to add to yesterday’s report” (05 January, spot at 6.8910). As was said, the danger is still negative even if the US Dollar’s slide from last month has eased. The only way to know if the negative pressure has subsided is if the price breaks through 6.9250 (the “strong resistance” mark was at 6.9400 yesterday). However, a drop is anticipated to encounter strong resistance above 6.8400.

    USD/JPY is likely to recover to 135.00 – UOB

    UOB Group economist Lee Sue Ann and markets strategist Quek Ser Leang provide hints about the likelihood of a rise to the 135.00 zone in the immediate term for the USD/JPY.

    usd

    View over the last 24 hours: “Our expectation for the USD to trade horizontally was wrong as it climbed to a high of 134.05 before tumbling to settle at 133.40 (+0.59%). The upward momentum has increased. Although the USD may advance further today, it is unlikely to confront the
    key barrier of around 135.00. (there is another relatively strong level at 134.50). The upward pressure will remain if the USD does not go below 132.55 (minor support is around 133.00).

    Within the next one to three weeks: “We said yesterday (05 January, spot at 132.00) that “downward pressure seems to have abated and USD has likely shifted into a consolidation phase” and that we anticipated USD to “trade between 129.50 and 133.50 for a length of time.” We were surprised by the sudden increase in the USD to 134.05. The price is likely in the early stages of a corrective comeback that might reach 135.00, and upward momentum is increasing. Within the next several days, USD should avoid falling below the “strong support” level, which is now around 131.50, to maintain the momentum.

    The EUR/USD is testing the 1.0500 level ahead of crucial data.

    The euro trades defensively against the dollar, encouraging EUR/USD to fluctuate around 1.0500 on Friday.

    Focusing on US NFP and EMU CPI for EUR/USD.

    Following the big decline in the previous session, the EUR/USD probes the area around 1.0500. This is all taking place against the background of the overall consolidation pattern observed in the global markets ahead of significant data releases on both sides of the Atlantic.

    On the latter, the US labor market report, Factory Orders, and the ISM Non-Manufacturing will command all the focus in the US data arena later in the European morning. At the same time, advanced inflation estimates in the wider Euroland for December will take center stage.

    Earlier on the old continent, in November, retail sales in Germany fell by an annualized 5.9%.

    Meanwhile, the German 10-year Bund rates add to Thursday’s modest increase by posting minor increases.

    What should I look for in the EUR?

    This week, the EUR/USD has encountered some good resistance at 1.0500 despite the return of the buy bias for the dollar. Given the significant data releases anticipated for later in the day, the price movement of the pair will probably be tested.

    AUD/USD will continue trading in a range, according to UOB

    Economist Lee Sue Ann and Markets Strategist Quek Ser Leang at UOB Group predict that the AUD/USD pair will trade in the area of 0.6660-0.6860 over the following weeks.

    usd

    “We underlined yesterday that the ‘quick surge looks to be exaggerated and AUD is unlikely to advance further,’ and we anticipated AUD to ‘trade sideways between 0.6770 and 0.6870,’” the 24-hour outlook reads. Instead of fluctuating in price, the Australian dollar plunged to a low of 0.6735 before finishing sharply at 0.6752 (-1.26%). Although the Australian dollar may continue to fall, oversold circumstances indicate that it is unlikely to test the support around 0.6700. (next support is at 0.6660). If 0.6820 (a minor resistance at 0.6790) were broken, it would indicate that the AUD’s weakness has steadied.

    Within the next three weeks: “Yesterday (05 January, spot at 0.6825), we emphasized that, despite higher momentum, AUD must break firmly above 0.6900 before a prolonged climb is probable. We said that the possibility of AUD breaking decisively above 0.6900 is now low, but it would be intact if it remained above 0.6735 over the next few days. In NY trading, NY fell sharply and hit a low of 0.6737, just shy of taking out 0.6735. Although 0.6735 isn’t crossed, the rising momentum has slowed. The AUD will probably trade between 0.6660 and 0.6860 for the time being, given the recent price movements, which are probably part of a long consolidation range.

    Please click here for the Market News Updates from 5 January, 2023.

  • Gold price forecast: The fall looks restricted as the XAU/USD stays low at $1,845

    Gold price forecast: The fall looks restricted as the XAU/USD stays low at $1,845

    Despite a minor increase in the US dollar, the price of gold retreated from a seven-month high. The likelihood of Fed rate rises of a lower magnitude supports the metal to some extent. A milder risk tone constraints the downside for the safe-haven XAU/USD.

    On Thursday, the gold price experienced some selling pressure and ended a four-day gaining run, reaching its highest level since June 2022, around the $1,865 level reached the day before. The XAU/USD is now trading in the $1,846–1,845 range, down around 0.50% for the day, and is still on the back foot going into the North American session.

    A little increase in the US dollar damages the price of gold.

    Following a hawkish tone from the Federal Open Market Committee (FOMC) December meeting minutes that were made public on Wednesday, the US dollar is edging higher. This is thus seen as a critical element weakening the price of gold expressed in US Dollars. In truth, the US Federal Reserve was planning to maintain higher interest rates for a more extended period and was still committed to reducing inflation.

    The US Nonfarm Payrolls (NFP) are still the primary focus.

    In anticipation of the much anticipated US monthly employment statistics on Friday, market investors also seem likely to reduce their negative wagers surrounding the US Dollar. The widely publicized NFP data may impact the Federal Reserve’s path toward raising rates and driving up USD demand. This will help investors predict the next leg of the non-yielding yellow metal’s directional advance.

    Choose less aggressive wagers. Federal Reserve supports the price of gold.

    gold

    The US Treasury bond rates are now hovering around a multi-week low due to the likelihood of lesser rate increases by the Federal Reserve, which may provide some support to the non-yielding Gold price. It’s important to remember that Fed policymakers agreed that the institution should pause its rapid interest rate rises. Thus, pessimistic traders should use some care.

    A softer risk tone helps to minimize losses for the price of gold.

    In addition, a lower risk tone may help limit the fall in the price of safe-haven gold. Even if China’s strict COVID-19 regulations have been loosened, investor mood is still being affected by worries of a worsening global economic collapse. This is clear from a recent move down in US market futures and may support the safe-haven currency pair XAU/USD.

    The fundamental environment is bullish.

    The aforementioned fundamental background leads to the conclusion that the price of gold will move upward against the least resistance, which supports the possibility of some dip-buying at lower levels. Therefore, it will be wise to hold off on preparing for any significant corrective collapse until there is actual follow-through selling before determining that the XAU/USD has peaked in the short term.

    The US macro data from Thursday may give everything a boost.

    Traders are now focusing on the US economic calendar, which includes publishing the Weekly Initial Jobless Claims report and the ADP data on private-sector jobs. This will affect the USD price dynamics and give the price of gold some momentum, along with the US bond rates. In addition, the general risk mood may help provide chances for short-term trading.

    Gold

    Technical forecast for gold prices.

    Any ensuing decline is anticipated to find support close to the last multi-month high, around the $1,833 region, from a technical standpoint. The $1,824–$1,822 horizontal resistance breakpoint follows, which should now serve as a short-term basis for the price of gold. If the support above levels is not held, technical selling may occur, pushing the XAU/USD down toward the $1,800 level.

    On the other hand, the overnight swing high in the $1,865 area may serve as a temporary roadblock for the price of gold before it reaches the $1,870 area. Bullish traders may see some follow-through purchasing as a new trigger, opening the door to a move toward recovering the $1,900 round number for the first time since May 2022.

  • 4 Global Market Updates- 5 January, 2023

    4 Global Market Updates- 5 January, 2023

    In this article, we have covered the highlights of global market news about the NZD/USD, GBP/USD, EUR/USD and USD/CAD.

    NZD/USD mixed outlook: UOB

    The forecast for NZD/USD remains mixed, with the pair trading between 0.6200 and 0.6380 for the time being, according to UOB Group’s Economist Lee Sue Ann and Markets Strategist Quek Ser Leang.

    “NZD regained the majority of its previous day’s severe decline as it rocketed to 0.6353 before relaxing to settle higher by 0.70%,” the 24-hour perspective said (0.6291). The price movements are probably part of a consolidation phase, and the NZD will probably trade today between 0.6255 and 0.6355.

    Within the next three weeks: “The recent choppy market movements have produced a mixed picture. For the time being, we anticipate the NZD to trade in a wide range between 0.6200 and 0.6380.

    GBP/USD is now seeing short-term consolidation – UOB

    According to market strategist Quek Ser Leang and economist Lee Sue Ann of UOB Group, GBP/USD is currently anticipated to trade in the band of 1.1900-1.2150 during the following weeks.

    usd

    24-hour perspective: “After falling significantly on Tuesday, GBP recovered and finished up 0.76%.” (1.2059). Since there is no downward pressure, GBP has entered a consolidation period. In other words, the GBP will move sideways today and is predicted to be between 1.2000 and 1.2115.

    Within the next one to three weeks: “We see the current GBP movement as a consolidating period. For the time being, GBP will trade between 1.1900 and 1.2150.

    EUR/USD is projected to find sturdy support around 1.0510 – UOB

    Markets Strategist Quek Ser Leang and Economist Lee Sue Ann of UOB Group predict that the EUR/USD will soon find significant support around the area of 1.0510.

    24-hour view: “EUR finished higher by 0.50%, recovering some of Tuesday’s sharp decline” (1.0599). The action is a consolidation, and today’s range for the EUR is predicted to be between 1.0565 and 1.0655.

    Within the next three weeks: “After the sudden decline on Tuesday (03 Jan), negative momentum is cautiously starting to develop. The euro is projected to trade with a tendency to fall, although any decrease is anticipated to run into strong support near 1.0510. Overall, the only way to tell whether the negative momentum has peaked is if it breaches the strong resistance’ level, now at 1.0675.

    USD/CAD maintains advances over the 1.3500 level and easily stands above the 100-day SMA.

    In the proximity of the support provided by the 100-day SMA, the pair draws some buyers and stages a moderate recovery from a one-month low reached earlier this Thursday. The pair maintains its intraday rebound gains through the early European session and is trading slightly above the psychological level of 1.3500.

    usd

    The safe-haven US Dollar is helped to gain momentum by a milder risk tone, therefore driving the USD/CAD pair higher. Despite China’s relaxation of the severe COVID-19 restrictions, fears of a worsening global economic crisis continue to weigh on investor mood and restrain market optimism. However, several reasons might prevent US Dollar bulls from making aggressive wagers and temporarily limit the major’s rise.

    The December FOMC policy meeting’s minutes revealed that all participants agreed to gradually raise borrowing rates. The Fed’s likelihood of further gradual rate increases is strengthened by the fact that US Treasury bond rates are still very close to the three-week low reached on Wednesday. The US Dollar should see a headwind as a result. In addition, a rise in crude oil prices might support the commodity-linked Loonie, which should alarm USD/CAD bulls.

    Traders are now focusing on the US economic calendar, which includes publishing the Weekly Initial Jobless Claims report and the ADP data on private-sector jobs. This will fuel USD demand and give the USD/CAD pair some momentum, coupled with US bond rates and the general risk attitude. In addition, oil price changes may provide possibilities for short-term trading. However, the spotlight is still on the US and Canadian monthly employment reports coming on Friday.

    Please click here for the Market News Updates from 4 January, 2023.

  • AUD/USD strengthens near 0.6800 as risk flows pick up.

    AUD/USD strengthens near 0.6800 as risk flows pick up.

    In a positive mindset, the AUD/USD is rising again over 0.6750. Risk flows and negative Treasury rates constrain the US Dollar bulls. Australian currency pair watches US ISM Manufacturing PMI and Fed Minutes.

    With risk flows returning to Asia on Wednesday, the AUD/USD is firming up to retake the 0.6800 barriers and getting a new bid around about 0.6720.

    The market is feeling better due to expectations for dovish Federal Reserve (Fed) Minutes, which support the higher-yielding Australian Dollar at the cost of the safe-haven US Dollar. The outlook for the Dollar is also being harmed by the resurgent weakening in US Treasury rates throughout the curve. The benchmark 10-year US rate is down 1.50% daily to 3.735%, while the US Dollar Index has fallen from levels close to 104.70 to 104.50 in Asia thus far.

    aud

    The most recent remarks from China’s Finance Minister Liu Kun, who supported proposals to adequately increase fiscal expenditure in light of the still-fragile economic recovery, are also helping to strengthen the AUD/USD pair.

    The publication of the US ISM Manufacturing PMI and the minutes of the Fed’s December meeting will be closely watched for new US Dollar trades and their effects on risk sentiment. The employment index is projected to be at 49.1, and the new orders index to increase to 48.1, but the overall ISM Manufacturing PMI is projected to fall to 48.5 in December.

    aud
Instagram
Telegram
Messenger
Email
Messenger
Email
Telegram
Instagram