

In this article, we’ll break down the components of a swing trade and talk about the tools and process involved in creating a straightforward trade setup. While no one trading strategy is flawless, you may use these best practices in combination with your own to find better entry and exit positions in trending market conditions. The simplest, most crucial, and usually underused tool in your trading toolbox is a trendline. The gradient or slope of a moving market may be determined objectively by drawing a line off important price highs and lows. This crucial stage might assist in pinpointing potential areas of support (floor) or resistance for the price (ceiling).
Daily Price Chart for DXY
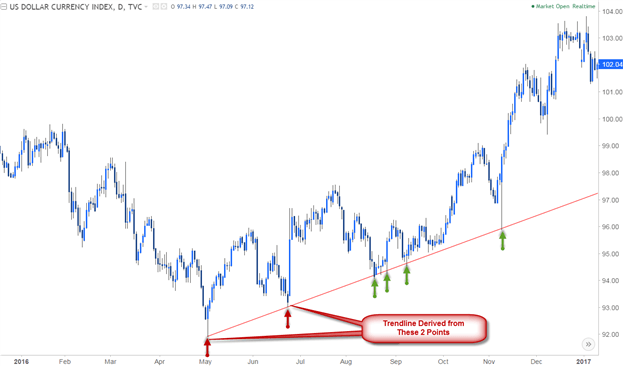
Because it involves some subjectivity, trendline analysis might be seen as more of an art than a science. However, while creating trendlines, the slope lends more certainty the more contact points the market has. This indicates that the trendline’s (slope’s) response becomes more effective.
The optimistic picture is set by the positive slope in the case of the US Dollar Index, with the overarching strategy being to purchase as prices rise. So, what should our point of entry be? The best entry would be a retreat towards trendline support.
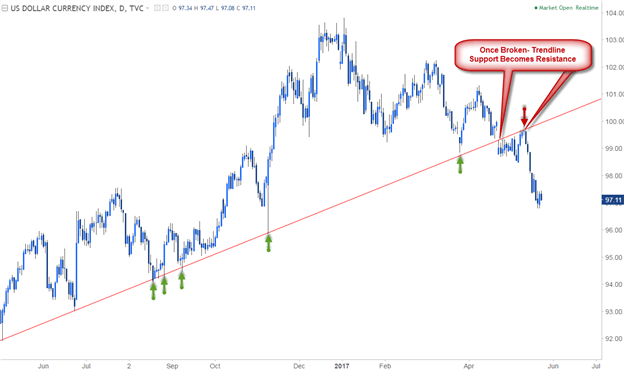
In the same vein, a break often presents sharper and more dramatic reversals. When a trendline support is broken, the slope turns into price resistance and often portends a shift in the way the market will behave. This slope may now be considered an invalidation reference for the current lower move.
DAILY PRICE CHART FOR AUD/NZD
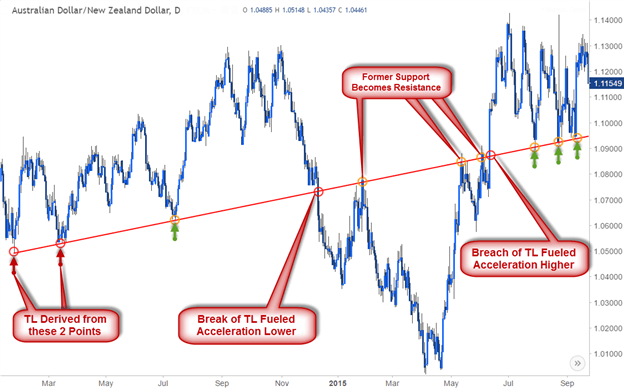
Similarly, when a trendline resistance is breached, that line acts as support for the next upward movement. The AUD/NZD example shown above demonstrates how a single trendline may provide plays as support and resistance on either side of the spectrum. The slope provided definite resistance on the second rebound in early 2015 after breaking in December before heading lower. Similar to the break above in June, the same trendline undoubtedly provided support for the subsequent surge higher.
TAKEAWAYS:-
- Three points affirm what two points indicate. While any two reference locations may provide a trendline, it is the third touch point that establishes the legitimacy of the slope. Therefore, search for that third touchpoint for confidence before depending too much on a certain gradient.
- When assessing the break, the period is one of the most crucial factors to take into account. Although you should always trade with the premise that the trendline will hold. As a general guideline, I’ll watch for a daily close to verify or disprove the break of a certain trendline. To confirm a break, watch for a response or change in behavior during the break, followed by a retreat and a retest of the slope as support or resistance. This is especially true when using shorter time frames. In the third instalment of this series, we’ll go into greater depth on multi-timeframe analysis.
- A trendline breach should encourage acceleration. Prices should move in the direction of the break when a slope acting as support or resistance is breached. Prices breaking and then failing to go forward will often indicate a “false break” situation (also known as a “throw-over”) scenario. These exhaustion transactions are common in established trends and often come before significant price reversals.
- Avoid chasing the break: When a trendline is broken, you should wait for a price retracement to test the slope as support; your stop should be below this level. Similarly, if support is broken, watch for the market to test the trendline again as resistance; the pivot high will serve as your stop loss.
The methodology’s foundation is this basic use of trendlines, which is consistent throughout slope analysis. In the second section, we’ll discuss how to use Pitchfork and Medina-Line analysis to find profitable targets (areas of support and resistance) within the framework of a certain trend.