
#edgeforex #trading #market #stocks #money #forex #inflation #gold #price #rates #dollar #candlestick #chart #cryprocurrency #bitcoin chart
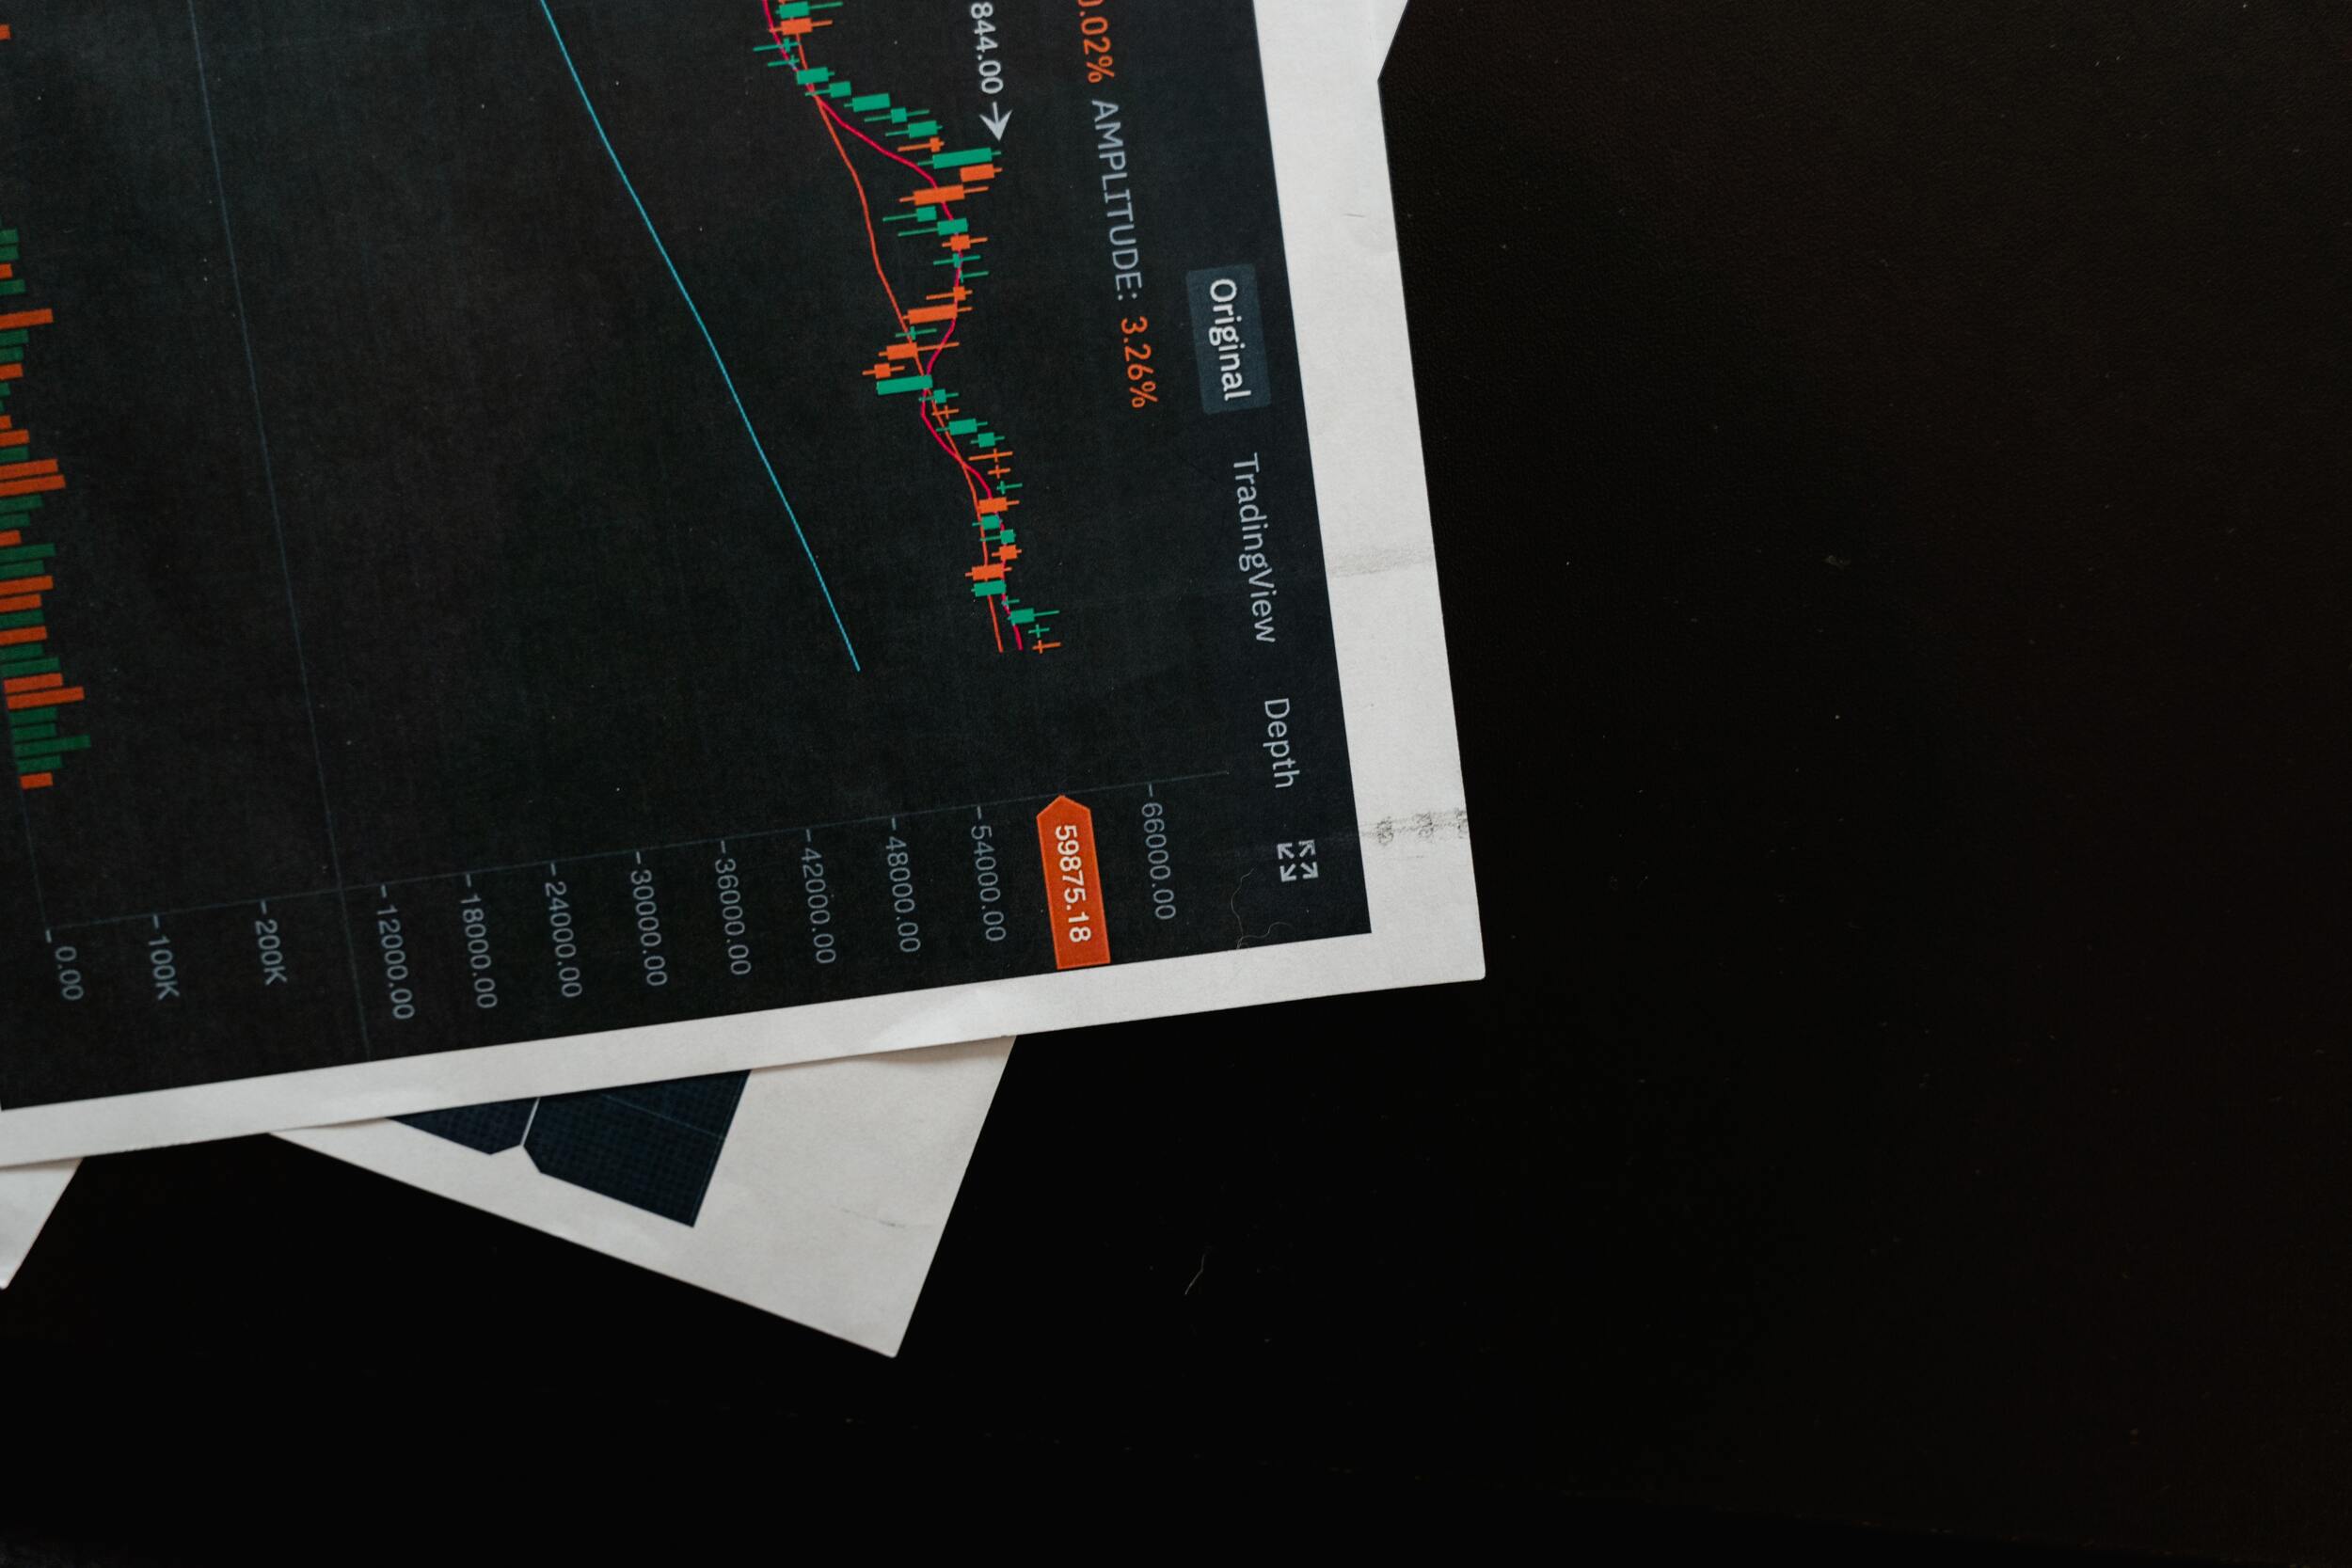
A candlestick chart is simply a chart made up of individual candles that traders use to analyse price action. Candlestick price action entails determining where the price opened for a period, where it closed for a period, and the price highs and lows for a specific period. Candlestick charts are very different from traditional bar charts. Traders generally prefer candlestick charts for day trading because they provide a pleasing visual representation of price. To apply candlestick chart analysis to a trading strategy, you must first understand the key components of a candle and what they indicate.
Price action can provide traders in all financial markets with information about trends and reversals.
Individual candlestick formations can also indicate buy or sell entries in the market.
The time-frame that each candle represents is determined by the trader. The daily time-frame is a popular time-frame, so the candle will show the open, close, high and low for the day. The various components of a candle can help you predict where the price will go; for example, if a candle closes far below its open, it may indicate further price declines.
A price candle is made up of three distinct points that is open, close, and wicks.
The first thing to consider are the open and close prices of the candles.
These points define where the price of an asset begins and ends for a given time period and will be used to build the body of a candle. When you look at the chart, each candle represents the price movement over a specific time period that you specify. If you looked at a daily chart, each candle will show the open, close, upper and lower wicks for that day.
Open price:
The open price is the first price traded when a new candle is formed. If the price begins to rise, the candle will turn green/blue (colors vary depending on chart settings). The candle will turn red if the price falls.
High Price:
The highest price traded during the period is indicated by the top of the upper wick/shadow. If there is no upper wick or shadow, this indicates that the open or close price was the highest price traded.
Low Price:
The lowest price traded is either the price at the bottom of the lower wick/shadow or, if there is no lower wick/shadow, the same as the close or open price in a bullish candle.
Close Price:
The close price is the last price traded during the candle formation period. In most charting packages, if the close price is less than the open price, the candle will turn red by default. If the close price is greater than the open price, the candle will be green or blue (also depends on the chart settings).
The Wick:
The wick, also known as a’shadow,’ is the next important component of a candlestick. These points are critical because they show the price extremes for a given charting period. The wicks are easily identified because they are thinner than the body of the candlestick. This is where the power of candlesticks is revealed. Candlesticks can assist traders in staying focused on market momentum rather than the static of price extremes.
Direction:
The colour of the candlestick indicates the price direction. If the closing price of the candle is greater than the opening price of the candle, the price is rising and the candle is green (the colour of the candle depends on the chart settings). If the candle is red, the price closed lower than it opened.
Range:
The range of a candle is the difference between its highest and lowest price. This can be calculated by subtracting the price at the top of the upper wick from the price at the bottom of the lower wick. (Range = highest – lowest point.)
Knowing what the points on a candle mean gives traders using a candlestick chart a distinct advantage when it comes to distinguishing trendlines, price patterns, and Elliot waves.