

TradingView is one of the most powerful and widely used platforms for traders. It provides real-time market data, advanced charting tools, and a vibrant trading community. Whether you trade forex, stocks, or cryptocurrencies, this technical analysis platform offers everything you need. Traders rely on TradingView for forex and stock trading charts, price analysis, and market trends.
This guide explains what TradingView is and how traders use it to improve their strategies. Whether you’re a beginner or an experienced trader, this platform has something for you.
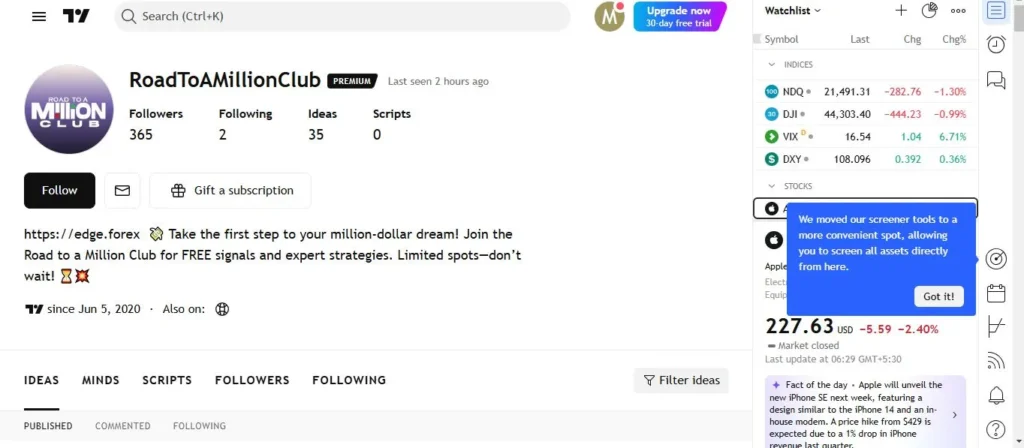
Before diving into the details, let’s introduce the TradingView setup. This is our profile, RoadToAMillionClub, where we share market insights, strategies, and analysis. Feel free to follow to stay updated on my latest trade ideas and chart breakdowns!
What Is TradingView?

TradingView is a web-based technical analysis platform that helps traders analyze financial markets. It provides real-time price data, interactive charts, and social networking features. Traders use it to track price movements and develop profitable strategies.
Why Traders Prefer TradingView
- User-Friendly Interface – It is easy to navigate and customize.
- Advanced Charting Tools – It offers a variety of indicators and drawing tools.
- Social Trading Community – Traders share ideas and strategies.
- Multi-Asset Support – It covers forex, stocks, commodities, and crypto.
- Customizable Alerts – Users receive notifications based on price movements.
A forex trader can use TradingView to track currency pairs, while a stock trader can analyze price charts. The platform adapts to different trading styles and strategies.
How Traders Use TradingView Charting Tools
One of the biggest reasons traders choose TradingView is its charting tools. These tools help traders visualize market trends and identify entry and exit points.
Key Features of TradingView Charts
- Multiple Timeframes – Analyze markets from 1-second to monthly charts.
- Variety of Chart Types – Candlestick, line, bar, and Heikin-Ashi charts.
- Drawing Tools – Trendlines, Fibonacci retracements, and support/resistance levels.
- Customizable Indicators – Apply moving averages, RSI, and Bollinger Bands.
Example
A forex trader looking to trade EUR/USD can use forex and stock trading charts to spot trends. By adding a moving average, they can confirm buy or sell signals.
How to Use TradingView Indicators for Better Trading Decisions

Indicators play a crucial role in technical analysis. TradingView indicators help traders analyze market trends and predict future movements.
Popular TradingView Indicators
- Relative Strength Index (RSI) – Measures overbought and oversold conditions.
- Moving Averages – Helps identify trend direction.
- Bollinger Bands – Shows volatility and price levels.
- MACD (Moving Average Convergence Divergence) – Identifies trend strength.
Example
A trader using forex and stock trading charts can apply RSI to confirm entry points. If RSI is below 30, it may signal a buying opportunity.
Setting Up Custom Alerts in TradingView
One of TradingView’s most useful features is price alerts. Traders don’t have to monitor charts constantly. Instead, they can set alerts for price movements or indicator signals.
Types of Alerts Available
- Price Level Alerts – Notify traders when an asset reaches a specific price.
- Indicator-Based Alerts – Triggered when an indicator meets certain conditions.
- Trendline Alerts – Activated when price breaks a trendline.
Example
A trader expecting a breakout in Bitcoin can set a price alert at $50,000. When the price hits this level, they get a notification and can take action.
How to Use TradingView Watchlists for Market Tracking

Tracking multiple assets is easier with TradingView’s watchlists. Traders can create custom lists and monitor price movements efficiently.
Benefits of Watchlists
- Organized Trading – Track stocks, forex, and crypto in one place.
- Live Price Updates – Get real-time price changes.
- Custom Sorting – Group assets by type or market conditions.
Example
A trader tracking Tesla, Apple, and Amazon stocks can create a watchlist for tech stocks. This way, they can monitor these stocks without switching tabs.
TradingView’s Social Trading Community
TradingView is more than just a technical analysis platform. It has a strong social trading community where traders share insights and strategies.
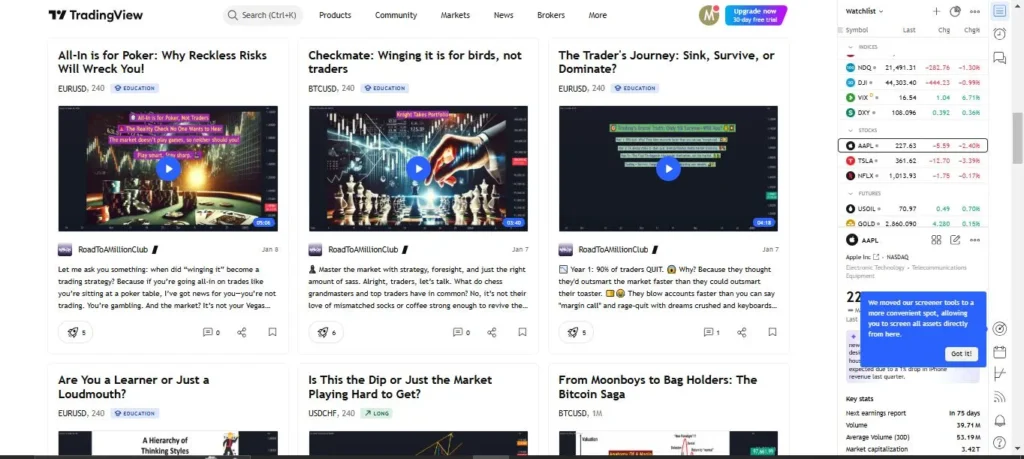
We don’t just analyze markets—We share insights! These are some of our published trade insights on TradingView, where I break down potential setups and strategies.
How the Community Helps Traders
- Follow Expert Traders – Learn from experienced market analysts.
- Share Chart Analysis – Get feedback on trade setups.
- Discuss Strategies – Engage in discussions on different trading approaches.
Example
A beginner can follow a professional trader and analyze their forex and stock trading charts. This helps them learn and improve their strategies.
Using TradingView for Paper Trading
Trading with real money can be risky. That’s why TradingView offers a paper trading feature. It allows traders to test strategies without financial risk.
Benefits of Paper Trading
- Risk-Free Practice – Trade without losing money.
- Strategy Testing – Experiment with different techniques.
- Performance Review – Analyze past trades and improve.
Example
A new trader can test a breakout strategy using a demo account before applying it to real trades. This helps them gain confidence.
Common Mistakes Traders Should Avoid on TradingView
Even though TradingView is a great technical analysis platform, traders can make mistakes. Avoiding these mistakes improves trading success.
Common Pitfalls
- Overloading Charts with Indicators – Too many indicators can create confusion.
- Ignoring Risk Management – Traders should always use stop-loss orders.
- Not Testing Strategies – Every strategy should be backtested before using real money.
Example
A trader using forex and stock trading charts should not rely on just one indicator. Instead, they should confirm signals with multiple indicators for better accuracy.
How Advanced Traders Use TradingView
Experienced traders take advantage of TradingView’s advanced features. They refine their strategies and make informed decisions.
Advanced TradingView Features
- Multi-Timeframe Analysis – Analyzing different timeframes for confirmation.
- Custom Pine Script Indicators – Developing custom indicators with TradingView’s coding language.
- Market Scanner – Filtering assets based on price trends and indicators.
Example
A professional forex trader may use multi-timeframe analysis to confirm trade signals. If a trend aligns on the daily and 4-hour charts, it strengthens their confidence in the trade.
Final Thoughts on TradingView
TradingView is a powerful technical analysis platform for traders of all levels. Its charting tools and indicators make market analysis simple and effective. Whether you’re trading forex, stocks, or crypto, this platform provides everything you need.
By using forex and stock trading charts, setting up alerts, and engaging with the community, traders can improve their strategies. With the right approach, TradingView can become an essential tool in your trading journey. Start exploring it today and take your trading to the next level!
Click here to read our latest article What Is Forex Factory and How Do Traders Use It?