

Decoding the AUD/USD Dilemma: How Hawkish RBA Messages and Global Tensions Weigh In
In the vast expanse of the global forex market, the AUD/USD Dilemma has unfurled as a standout subplot. As currencies continually adjust to the ceaseless ebb and flow of geopolitical scenarios and pivotal central bank verdicts, it’s paramount for stakeholders to decode the enigma of the AUD/USD trajectory.
A Fundamental Backdrop
The Australian dollar, emblematic of the economic vitality of the Land Down Under, has experienced a volatile phase. This fluctuation is attributable to a confluence of domestic determinants and global influences. Notably, the currency saw some bullish moments, riding on favorable domestic indicators such as the low unemployment statistics. The optimism from these metrics was further accentuated by the hawkish tones emanating from the Reserve Bank of Australia (RBA) meetings and official communiqués.
Source: dfx
Yet, lurking in this ostensibly rosy picture is the formidable challenge of inflation. There’s a burgeoning sentiment among market watchers that measures to dampen inflationary impulses have lacked the requisite rigor and urgency. The much-anticipated Australian inflation data, should it veer towards the lower spectrum, could be the linchpin that steers the narrative around the AUD/USD Dilemma, potentially shedding light on the RBA’s forthcoming strategic stance.
The US Data and the Middle East Context
While Australia’s fiscal contours remain integral to this story, the fiscal health and geopolitical strategies of the U.S. play an undeniable role in the unfolding of the AUD/USD dynamics. The US’s consistent robust economic output threatens to further amplify the USD’s strength vis-à-vis the AUD, adding yet another layer to the intricate AUD/USD conundrum.
Moreover, the intricate geopolitics of the Middle East, with its perpetual state of flux, is also casting its long shadow on this currency pair. The prevailing ‘risk-averse’ sentiment, fueled by Middle Eastern complexities, has been a significant tailwind for the USD. If these regional tensions continue to simmer or even escalate, the implications for the AUD/USD axis could be profound.

Diving into Technical Analysis
Warren Venketas’ detailed technical exposition on TradingView of the AUD/USD weekly trajectory offers compelling insights. The evident blue-highlighted long upper wick weekly candle appears to be signaling an impending bearish stance, should the current trends persist.
The more granular daily charts also weave an interesting tale. With the downward-leaning trendline resistance coming into focus, there’s a palpable pressure around the October support zones. The persistent nudging against these support parameters might be a precursor to a more significant shift. The mirror-image reflection of the November 2022’s low at 0.6272, reminiscent of a descending triangle, further augments the bearish prognosis. The RSI’s current stance, hovering below the neutral midpoint, corroborates this perspective.
Key Resistance and Support Levels
A nuanced understanding of the resistance and support markers is a sine qua non for those navigating the AUD/USD maze. Noteworthy resistance landmarks include 0.6500, 0.6459, the illustrative 50-day moving average juxtaposed with the trendline resistance, and the 0.6358 point. Conversely, the pivotal support thresholds are delineated at 0.6272 and 0.6170. Mastery over these metrics will be indispensable for stakeholders engaged with this currency dyad.
IG Client Sentiment Data
Incorporating sentiment data into the analysis, the IG Client Sentiment (IGCS) offers a perspective that’s often at odds with market trends. As of now, IGCS highlights that a staggering 84% of retail traders are net LONG on AUD/USD. This data might seem counterintuitive given the underlying market dynamics, but it underscores the unpredictability of the forex market and the multifaceted nature of the AUD/USD Dilemma.
Exploring Factors as GBP/USD Faces Downward Pressure: Key Technical and Geopolitical Insights Ahead.
The recent events in the foreign exchange market present a scene of dynamic movements and unpredictable patterns. Particularly, the GBP/USD Faces Downward Pressure, teetering on the brink of a potential freefall. As traders and investors worldwide navigate these turbulent waters, understanding the underlying reasons behind this looming downtrend becomes crucial.
GBP/USD Faces Downward Pressure: The Fundamental Backdrop
At the core of the GBP/USD dilemma is a mix of both domestic and international factors. The British Pound (GBP), traditionally seen as a reflection of the UK’s economic and political health, has recently struggled to find a firm footing. Despite labor data showing some positivity, comments from the Bank of England Governor and policymakers suggest a diminishing likelihood of any rate hikes in 2023. This sentiment has become a significant drag on the GBP, further amplifying the GBP/USD Faces Downward Pressure narrative.
Simultaneously, the US dollar’s robust performance, backed by a bullish rally in the Dollar Index (DXY) and underlined by a rise in US Yields, has overshadowed the GBP. With the question lingering – “how high can the DXY go?” – the GBP’s potential vulnerability becomes more pronounced.
US Influences and Geopolitical Undercurrents
As the GBP/USD Faces Downward Pressure, understanding the US’s influence is paramount. The DXY is an instrumental indicator, especially as it doesn’t currently show signs of sustained selling pressure. A combination of the trajectory of US Yields and geopolitical tensions ensures the DXY remains a potent force in the forex world. This strength suggests that short-term USD buying opportunities might arise during dips, as risk sentiment alternates between risk-on and risk-off modes.
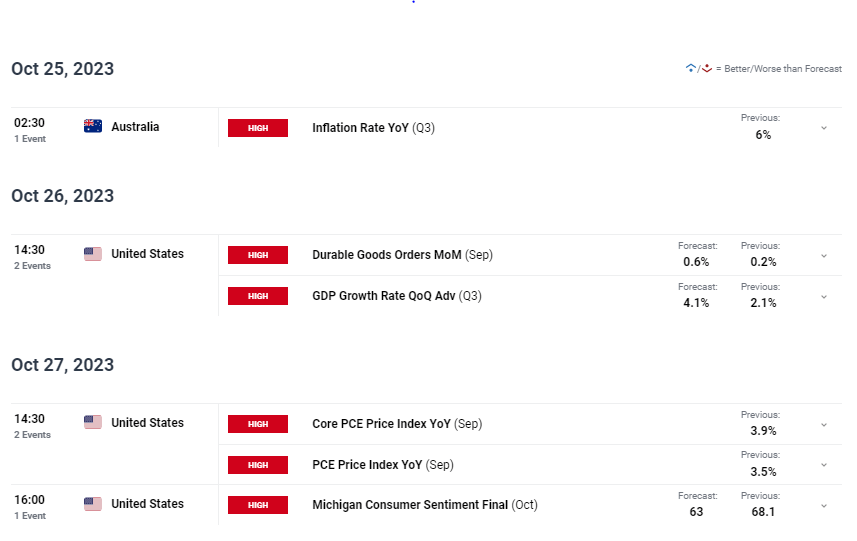
Adding another layer of complexity is the upcoming US Q3 GDP data. Expectations are soaring with the US economy anticipated to exhibit a growth of 4.3% for the quarter, a considerable leap from the 2.1% in Q2. However, despite these optimistic projections, even a surpassing of these expectations might not be adequate for a sustained break above resistance in the DXY. With the upcoming Federal Reserve meeting and the overall market mood, traders and market participants tread cautiously, further highlighting why GBP/USD Faces Downward Pressure.
Technical Landscape and GBP’s Dilemma
On the technical front, GBP/USD is revisiting its recent lows, approaching a pivotal support area. Should this area succumb, the GBP could be thrust towards the daunting 1.2000 psychological mark. The gravity of breaking this level is profound. Not only would it herald a significant bearish trend, but it would also be indicative of the broader GBP/USD Faces Downward Pressure narrative coming to fruition.
Recent technical markers like the trendline rejection and the marubozu candle close foreshadow further bearish momentum for the GBP. However, some temporary USD weakness during the European session has momentarily halted this slide. Yet, a daily candle close below the 1.2080 mark might remain elusive. The impending Central Bank meetings could see the GBP/USD oscillating between the 1.2080 and 1.2280 markers.
Other Noteworthy Influences
Amidst all this, we mustn’t overlook the US dollar’s safe-haven appeal, which can amplify if geopolitical tensions escalate. This appeal could further strain the GBP, particularly as there’s no significant data in its favor for the remainder of the week. With no immediate rescue for the GBP, the GBP/USD Faces Downward Pressure narrative appears more compelling.
Key Levels To Monitor
For those keenly observing this forex pair, several levels warrant close attention. On the support side, 1.2080, 1.2030, 1.2000 (a critical psychological level), and 1.1850 are the ones to watch. As for resistance, the primary zones are 1.2182, 1.2312, and 1.2399.

Conclusion
In the intricate maze of the global forex landscape, the AUD/USD dilemma and the pressures on GBP/USD stand out as emblematic of the challenges and opportunities inherent in such volatile markets. Woven into this are multifarious variables: from the RBA’s assertive stances and impending Australian inflation data to the UK’s economic nuances and the US’s fiscal pulse, all set against the backdrop of broader geopolitical tensions.
As the market teeters on the brink of pivotal data releases and geopolitical shifts, traders and investors must remain both informed and agile. The evolving narratives of AUD/USD and GBP/USD serve as testament to the fluidity of the financial world, urging stakeholders to recalibrate, strategize, and leverage their moves carefully in this ever-evolving dance of currencies.
Click here to read our latest article on Bitcoin ETF Speculation Ignites 17 month high

I’m Vinit Makol, and I write to make sense of the markets, from forex and precious metals to the macro shifts that drive them. Here, I break down complex movements into clear, focused insights that help readers stay ahead, not just informed.