

Introduction to Fractal Trading Strategies
In the world of Forex trading, success often depends on the ability to decipher the intricate dance of price movements. Traders constantly seek tools and strategies that provide an edge in predicting market directions. One such powerful tool is Fractal Trading Strategies. In this comprehensive guide, we will delve into the world of fractals in Forex trading, exploring their definition, significance, and practical application.
Definition of Fractals in Forex Trading
Fractals in Forex trading refer to repetitive and self-similar patterns that occur within price charts. These patterns are composed of a series of highs and lows and play a crucial role in understanding market dynamics. By identifying fractals, traders can gain valuable insights into potential trends and reversals.
Importance of Understanding Fractals in Analyzing Price Movements
To succeed in Forex trading, one must have a deep understanding of the underlying market dynamics. Fractal analysis forms the cornerstone of this understanding. It equips traders with the ability to recognize recurring patterns within price charts, helping them make informed decisions about market entry, exit, and risk management. Now, let’s explore the fundamentals of fractals in Forex trading.
Understanding Fractals in Forex Trading
Illuminating the Mysteries of Fractals as Price Chart Patterns
Fractals, within the realm of Forex trading, are akin to secret codes embedded in price charts, offering profound insights into market behavior. These intricate patterns consist of a minimum of five consecutive bars, with the middle bar displaying either the highest high (bullish fractal) or the lowest low (bearish fractal). What sets fractals apart is their ability to repeat across different timeframes, providing traders with a multi-dimensional window into price movements.
Decoding the Characteristics of Fractals – Peaks and Valleys
To fully grasp the significance of fractals, one must delve into their defining characteristics:
- Bullish Fractal: This manifestation occurs when the central candlestick boasts the highest high in its midst, flanked by two lower highs. Picture it as a beacon of optimism amid the chaos.
- Bearish Fractal: On the flip side, a bearish fractal takes shape when the middle candlestick showcases the lowest low, surrounded by two higher lows. Here, it serves as an omen of impending pessimism.
These seemingly simple patterns hold the key to deciphering the transition between potential uptrends and downtrends within a price chart, acting as navigational markers for traders seeking direction in the tumultuous waters of the Forex market.
Guiding Traders with the Power of Fractals
Fractals emerge as indispensable tools in the trader’s toolkit, enabling them to navigate the treacherous terrain of Forex trading with greater confidence and precision. When strategically employed alongside other technical indicators, fractals offer a holistic perspective on market conditions, empowering traders in the following ways:
- Anticipating Trend Reversals: Fractals step into the spotlight as early harbingers of impending trend shifts. Their appearance on the chart often signals the initiation of a new market direction, giving traders the opportunity to position themselves advantageously.
- Setting the Parameters for Risk Management: Fractals play a pivotal role in defining strategic price levels for risk management. Traders can pinpoint potential stop-loss and take-profit levels with greater accuracy, enhancing their risk-reward ratios.
- Assessing Trend Strength: Beyond predicting reversals, fractals serve as barometers of trend strength. By analyzing the frequency and distribution of fractals, traders gain valuable insights into the sustainability of existing trends, helping them make informed decisions regarding their positions.
In essence, understanding the language of fractals is akin to acquiring a unique skillset that allows traders to decipher the subtle messages hidden within price charts. As we journey deeper into the world of fractal trading strategies, we will explore how these patterns can be leveraged to make more informed trading decisions, identify breakout opportunities, and ultimately enhance one’s success in the dynamic Forex market.
Identifying Trend Reversals with Fractals
Navigating Market Swings: Unraveling the Power of Fractals
The ability to identify trend reversals is a prized skill in the arsenal of any discerning trader. Within this realm, fractal analysis emerges as a beacon, casting light on potential shifts in market sentiment. As we venture deeper into the intricacies of fractals in Forex trading, we unravel the methods by which these patterns enable us to recognize trend reversals and seize opportunities.
Using Fractals to Recognize Potential Trend Shifts
The heart of fractal analysis lies in its capacity to discern potential trend reversals. When a series of fractals materializes on a price chart, it acts as a signal, suggesting an alteration in the prevailing market direction. Picture this: a sequence of lower highs and lower lows gradually forms, akin to a set of descending stairs. This arrangement often heralds a bearish trend, characterized by declining prices. Conversely, the appearance of a sequence featuring higher highs and higher lows paints a portrait of a bullish trend, reflecting rising market optimism.
Strategies for Interpreting Fractals to Anticipate Reversals
1. Fractal Breakouts as Signals of Trend Reversal
One of the most potent tools within the trader’s arsenal is the concept of “fractal breakouts.” This strategy involves keenly observing fractals as they form and then monitoring their behavior. When a fractal begins to break out beyond the confines of its prior high or low, it serves as a resounding alarm bell signaling a potential trend reversal. For traders, this breakout moment represents an opportune entry point into the market. It’s akin to catching a wave just as it begins to crest, riding the momentum of a new trend.
2. Confirmation Indicators to Validate Potential Reversals
To bolster the reliability of fractal-based signals, traders frequently employ confirmation indicators, which act as a second pair of eyes validating the signals emitted by fractals. These indicators include:
- Moving Averages: These are widely used to gauge the average price over a specific period. When a moving average crosses above or below the current price, it can confirm a trend reversal suggested by fractals.
- Relative Strength Index (RSI): RSI measures the strength and speed of price movements. Overbought and oversold conditions indicated by RSI can corroborate potential trend reversals.
- Moving Average Convergence Divergence (MACD): MACD involves the calculation of two moving averages and provides insights into the momentum of a trend. Divergences between the MACD and price movements can signal impending reversals.
By integrating these confirmation indicators with fractal analysis, traders can enhance their ability to discern true trend reversals from market noise, fostering a more precise and informed approach to trading.
In conclusion, the power of fractals in identifying trend reversals cannot be overstated. These patterns serve as the trail markers in the Forex wilderness, guiding traders through the complexities of market dynamics. Whether through the breakout strategy or the reinforcement of signals with confirmation indicators, fractals empower traders to make decisions with greater confidence and accuracy. As we continue our journey into the world of fractal trading strategies, we will explore how to capitalize on breakout opportunities and navigate the Forex market with finesse.

Strategies for Breakouts Using Fractals
Mastering Breakout Trading: Leveraging the Power of Fractals
In the ever-evolving landscape of Forex trading, breakout strategies stand out as a formidable approach, allowing traders to ride the waves of price volatility. Within this realm, fractals emerge as invaluable allies, offering insights and precision in identifying breakout points. Let’s delve into the world of breakout trading and discover how fractals play a pivotal role.
Definition of Breakout Trading in Forex
Before we proceed further, let’s define the essence of breakout trading in the context of Forex. Breakout trading revolves around the concept of capitalizing on price movements that “break out” of predefined ranges or patterns. Traders employing this strategy seek to enter the market at the precise moment when the price breaches established levels of support or resistance, anticipating substantial price swings.
How Fractals Assist in Identifying Breakout Points
Fractals serve as invaluable tools for traders seeking to identify breakout points with precision. They accomplish this by shedding light on key levels of support and resistance within price charts. These levels are akin to invisible barricades that hold the price within a certain range. When price action breaches these barriers, it signals a potential breakout, and this is where fractals come into play.
Imagine fractals as the sentinels of the trading arena, vigilantly watching price movements. As the price approaches a critical juncture, a fractal may form, hinting at the possibility of a forthcoming breakout. This formation alerts traders to potential breakout opportunities, enabling them to prepare for decisive action.
Implementing Breakout Strategies with Fractals
1. Setting Entry and Exit Points Based on Fractal Breakouts
The cornerstone of effective breakout trading with fractals lies in establishing well-defined entry and exit points. Traders keenly observe the formation of fractals as price approaches crucial levels of support or resistance. Here’s how it works:
- Bullish Fractal Breakout: When a bullish fractal forms and the price subsequently breaches the high of that fractal, it signals an opportunity for traders to enter a long (buy) position. This breakout suggests that the price is breaking free from a previous resistance level, potentially embarking on an upward journey.
- Bearish Fractal Breakout: Conversely, a bearish fractal breakout occurs when the price breaks below the low of a bearish fractal. This signifies an opportunity for traders to enter a short (sell) position. The breakout suggests that the price is breaking down from a previous support level, potentially commencing a downward trajectory.
2. Risk Management Techniques for Breakout Trading
While the allure of breakout trading with fractals is undeniable, it is essential to pair this strategy with effective risk management techniques. The inherent volatility of breakout trades can lead to substantial gains but also entails a degree of risk. Here are some key risk management considerations:
- Stop-Loss Orders: Implementing well-placed stop-loss orders is crucial to limit potential losses. These orders are designed to automatically exit a trade if the price moves against the trader beyond a predefined level.
- Position Sizing: Determining the appropriate size of a position is essential for managing risk. Traders should avoid overleveraging their accounts and ensure that each trade aligns with their risk tolerance.
- Take-Profit Targets: Setting take-profit levels based on fractal breakouts can help secure profits. These levels are determined by assessing potential price targets and can vary depending on the trader’s strategy and risk-reward ratio.
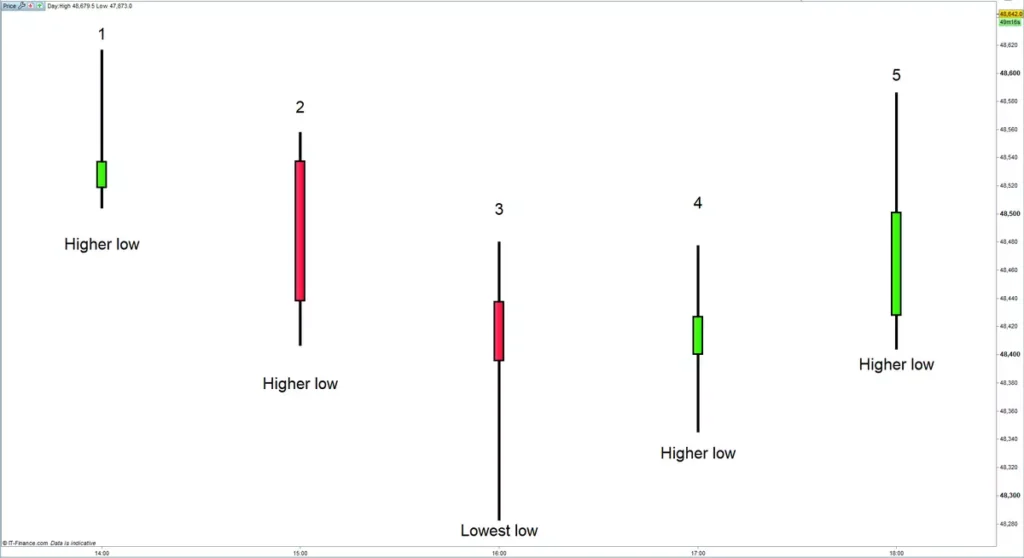
In the realm of technical analysis, a fractal serves as a distinct pattern for identifying trend reversals using a series of five bars or candles. When examining a bullish fractal reversal pattern, the following characteristics are notable:
- The third candle within this sequence of five will depict the lowest low.
- The first two candles in the pattern will display higher lows in comparison to the middle candle.
- The final two candles in the series will exhibit higher lows than the middle candle.
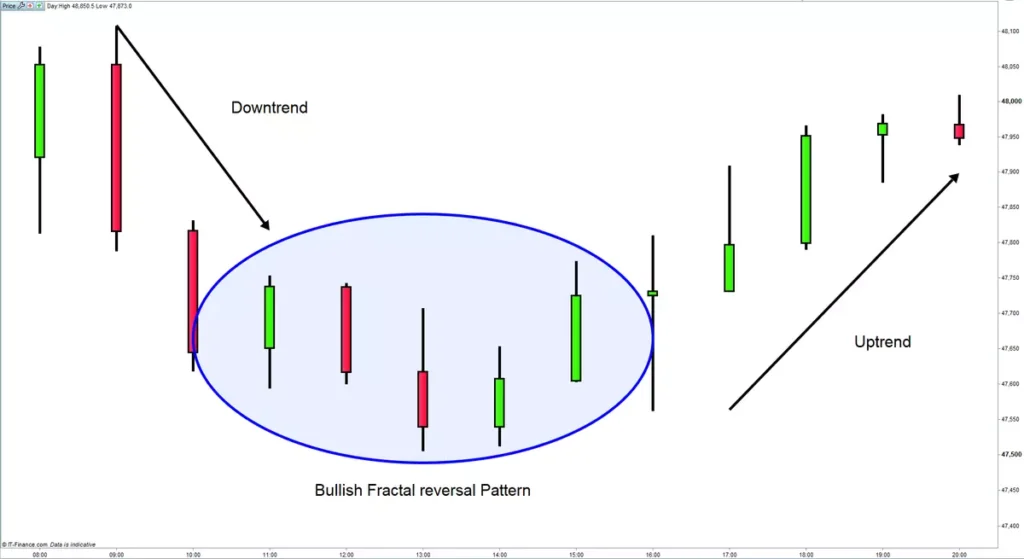
For a visual representation, please refer to the diagram below:
A bullish fractal reversal pattern signifies a potential shift from a short-term downtrend to the beginning of an upward trend. Traders often interpret this pattern as a signal to consider entering a long position or possibly exiting an existing short position.
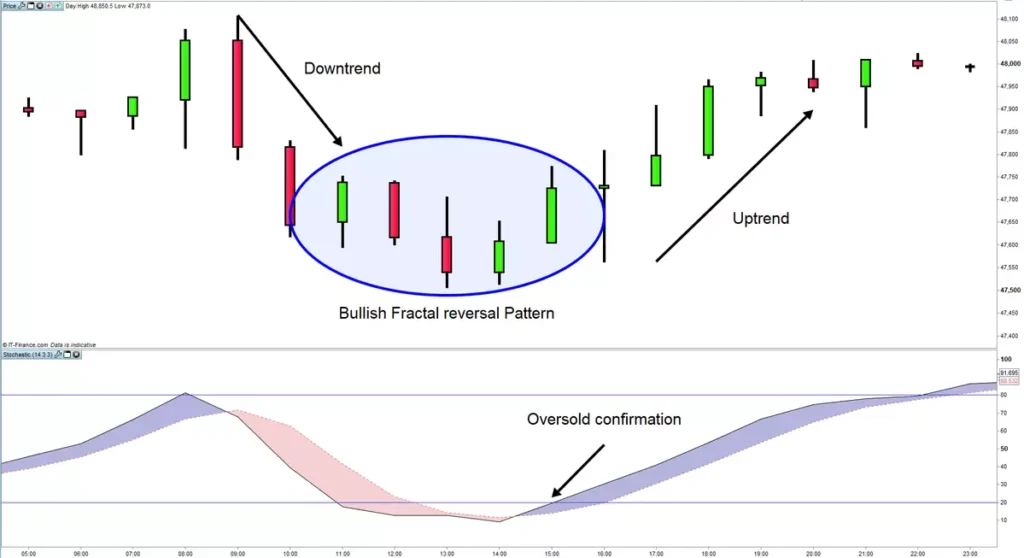
Many traders opt to complement fractal signals with oscillators like the stochastic or relative strength index (RSI) to validate a bullish buy signal. Consequently, a fractal buy signal gains more credibility when it coincides with an oversold signal.
Now, let’s delve into the bearish fractal reversal pattern:
- The third candle within the sequence of five will record the highest high.
- The first two candles in this pattern will demonstrate lower highs compared to the middle candle.
- The final two candles in the sequence will display lower highs than the middle candle.
For a visual representation, please consult the diagram below:
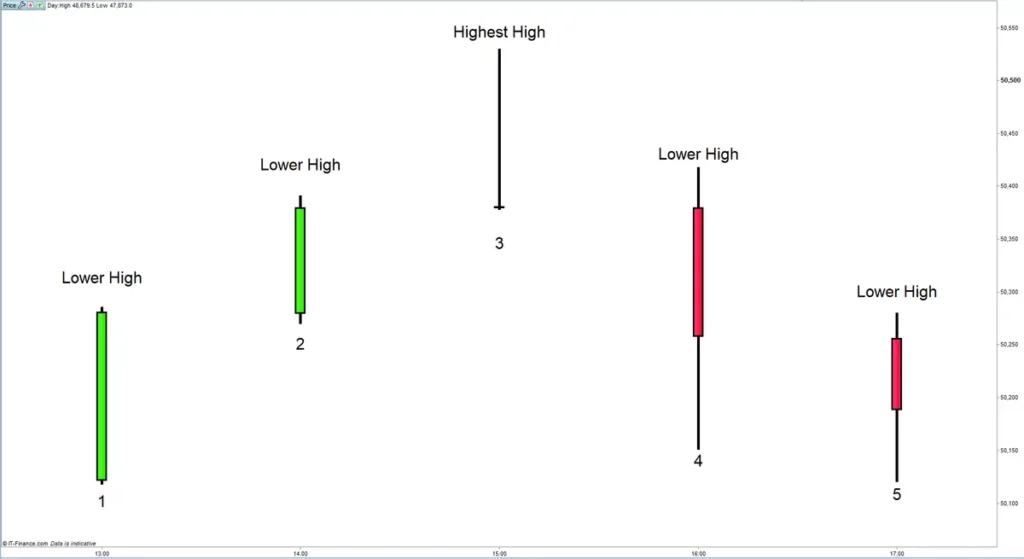
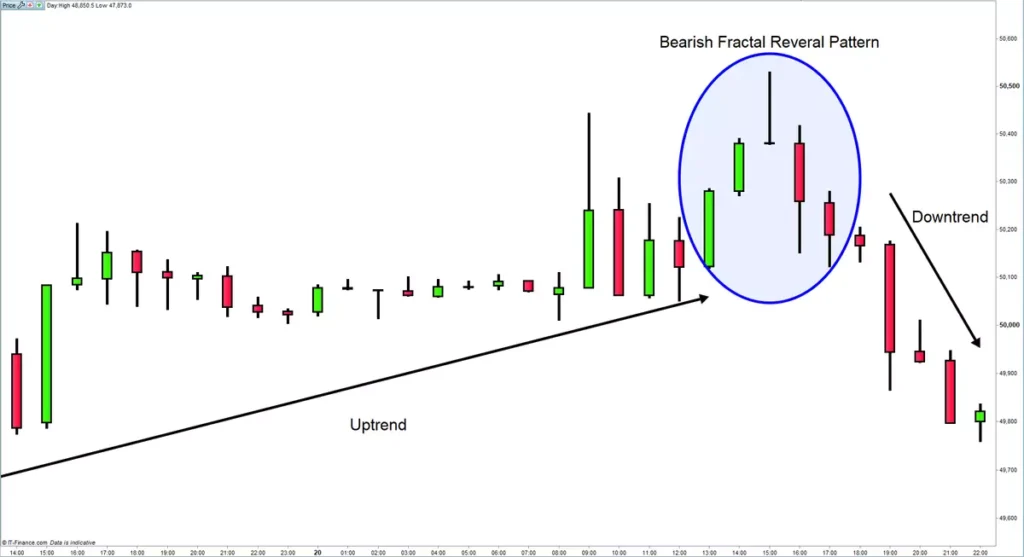
A bearish fractal reversal pattern implies a potential transition from a short-term uptrend to a possible commencement of a downtrend. Traders might interpret this pattern as a signal to contemplate entering a short position or to consider exiting an existing long position.
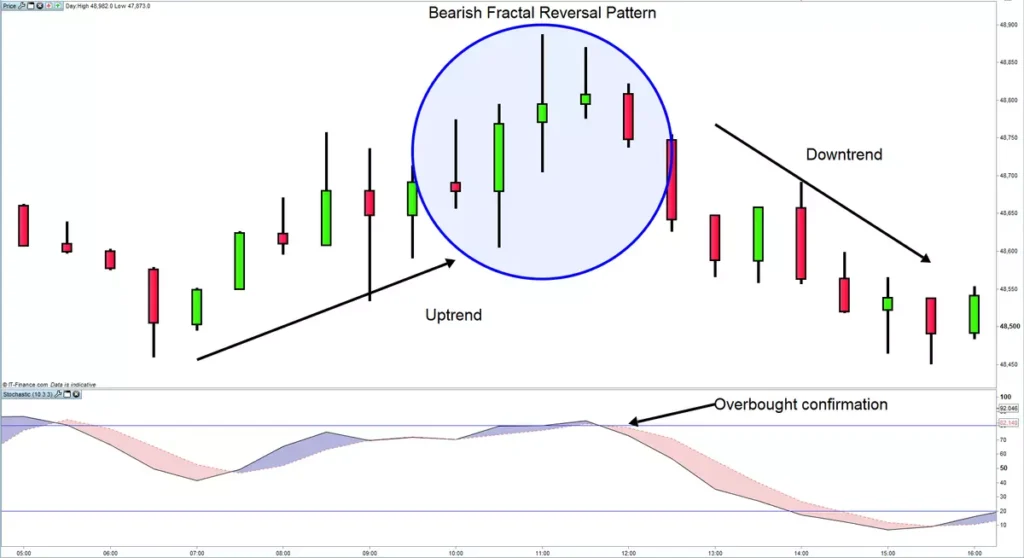
Traders often choose to integrate fractal signals with oscillators like the stochastic or RSI to validate a bearish sell signal. Consequently, a fractal sell signal holds more weight when it aligns with an overbought signal.
By understanding these distinctive patterns and their implications, traders can make more informed decisions when navigating the complex landscape of financial markets.
In conclusion, the fusion of breakout trading with the analytical power of fractals opens up a world of opportunities for Forex traders. These strategies allow traders to seize moments of price volatility and harness them for potential profits. However, it is essential to approach breakout trading with caution and adhere to sound risk management principles to mitigate potential downsides. As we journey deeper into the realm of practical applications for fractals in Forex trading, we will explore real-life examples and case studies that illustrate the efficacy of these strategies in action.
Practical Application of Fractals in Forex Trading
Bridging Theory with Reality: Navigating Forex with Fractals
As we journey through the fascinating landscape of Forex trading, the theoretical understanding of fractals takes on a practical dimension. To grasp the true essence of fractal trading strategies, we turn our attention to real-life examples, case studies, and the avoidance of common mistakes. These facets reveal the invaluable role of fractals in the hands of discerning traders.
Real-Life Examples Demonstrating the Use of Fractals in Trading
Imagine a scenario where a trader is confronted with a bearish fractal pattern forming on their price chart. The trader, well-versed in fractal analysis, doesn’t act hastily but takes the time to confirm this signal with the aid of technical indicators. This prudent approach pays off handsomely as the trader executes a short trade in a clearly downtrending market. Here, we find a tangible illustration of how fractals can be wielded as indispensable tools in the trader’s arsenal.
In this practical scenario, the trader adheres to a systematic process:
- Identification of Bearish Fractal: The trader spots a bearish fractal pattern, characterized by the central candlestick displaying the lowest low, flanked by two higher lows. This pattern suggests a potential trend reversal to the downside.
- Confirmation with Technical Indicators: Rather than relying solely on the fractal signal, the trader turns to technical indicators like the Relative Strength Index (RSI) and Moving Average Convergence Divergence (MACD) to confirm the bearish sentiment. These indicators exhibit signs of overbought conditions and bearish divergence, reinforcing the trader’s conviction in the impending downtrend.
- Execution of Short Trade: With a solid foundation of evidence, the trader takes a calculated risk and enters a short trade, betting on the market’s downward trajectory.
This real-life example underscores the practical utility of fractals. They serve as initial signals, prompting traders to delve deeper into their analysis and employ confirmation indicators to enhance decision-making. It’s akin to having a compass to point you in the right direction, and then cross-referencing with a map to confirm your path.
Case Studies Illustrating Successful Trades Using Fractals
To further emphasize the potential profitability and reliability of fractal-based strategies, let’s explore specific case studies. These instances shed light on how astute traders have harnessed the power of fractals to their advantage:
Case Study 1: The Breakout Opportunity
In this case, a trader identifies a bullish fractal pattern, indicative of a potential upward reversal. Coupled with a breakout above the fractal’s high, the trader enters a long position. The price subsequently surges, yielding substantial profits.
Case Study 2: Navigating a Range-bound Market
Here, a trader encounters a market locked in a sideways range. By employing fractals to identify key support and resistance levels, the trader strategically places buy and sell orders at these levels. As the price oscillates within the range, the trader profits from multiple trades until a breakout occurs.
Case Study 3: The Art of Risk Management
This case emphasizes the importance of risk management when using fractals. A trader who diligently sets stop-loss orders and adheres to position sizing principles avoids substantial losses even when some trades based on fractal signals turn unfavorable.
Common Mistakes to Avoid When Using Fractals in Trading
While fractals offer a potent toolset, traders must be vigilant against common mistakes that can erode their efficacy. Here are some pitfalls to avoid:
- Over-Reliance on Fractals: Relying solely on fractals without corroborating evidence from other technical indicators can lead to false signals. It’s essential to use fractals as part of a comprehensive analysis.
- Ignoring Fundamental Factors: Neglecting fundamental analysis and market context can be detrimental. Fractals should complement, not replace, a holistic trading approach.
- Failing to Adapt: Markets evolve, and strategies must adapt accordingly. Sticking rigidly to a single approach may result in missed opportunities or losses.
In conclusion, the practical application of fractals in Forex trading bridges the gap between theory and reality. Real-life examples and case studies showcase their effectiveness in guiding trading decisions, while the awareness of common mistakes serves as a compass for traders to navigate potential pitfalls. As we continue to explore advanced tips and best practices in the world of fractal trading strategies, it becomes evident that mastering these patterns can be a game-changer in the dynamic realm of currency trading.
Advanced Tips and Best Practices
As seasoned traders continue to refine their skills, they delve into advanced tips and best practices that can provide an extra edge in the dynamic world of Forex trading. The following insights explore how traders can leverage multiple timeframes, integrate fractals with other technical indicators, and adapt fractal strategies to diverse market conditions.
Using Multiple Timeframes for Fractal Analysis
Fractal analysis reaches new heights when traders embrace the concept of multiple timeframes. Instead of focusing solely on a single timeframe, traders extend their analysis to encompass several timeframes simultaneously. This approach yields a broader perspective on market trends and enhances the accuracy of fractal-based analysis.
Here’s how it works:
- Long-Term Timeframes: By examining long-term timeframes such as daily or weekly charts, traders gain insights into overarching trends. These timeframes help identify significant support and resistance levels, allowing for a more comprehensive understanding of the market’s overall direction.
- Intermediate Timeframes: Intermediate timeframes, like the 4-hour or 1-hour charts, offer a mid-range view of market dynamics. They help traders pinpoint key turning points and confirm signals derived from longer-term analysis.
- Short-Term Timeframes: Short-term timeframes, such as 15-minute or 5-minute charts, provide a close-up view of price movements. These timeframes assist traders in fine-tuning their entry and exit points, enhancing precision in their trades.
By harmonizing the information gleaned from various timeframes, traders can validate the validity of fractal signals. A fractal pattern that aligns with the trend direction across multiple timeframes carries more weight and offers a stronger basis for decision-making.
Combining Fractals with Other Technical Indicators for Better Accuracy
To elevate the accuracy of trade signals, traders frequently fuse fractals with a symphony of technical indicators. These indicators can include moving averages, Fibonacci retracements, oscillators like the Relative Strength Index (RSI), and the Moving Average Convergence Divergence (MACD).
Here’s how the combination enhances precision:
- Moving Averages: Moving averages provide a smoothed representation of price trends. When combined with fractals, they offer a confirming or cross-referencing tool, aligning the trader’s perspective.
- Fibonacci Retracements: Fibonacci retracements help identify potential reversal levels. When fractal signals coincide with Fibonacci levels, it strengthens the conviction behind trade decisions.
- Oscillators (RSI and MACD): Oscillators gauge the strength and momentum of price movements. Divergences between oscillator signals and fractal patterns can serve as powerful indicators of trend reversals.
By weaving together the insights derived from fractals with the confirmation provided by technical indicators, traders can minimize false positives and enhance the reliability of their trading signals. It’s akin to conducting a symphony where each instrument complements the others, producing a harmonious and accurate result.
Adapting Fractal Strategies to Different Market Conditions
Successful traders understand that markets are not static entities; they evolve and transition through various conditions. Therefore, one of the best practices in fractal trading is the ability to adapt strategies to suit different market environments.
Here’s how traders can accomplish this:
- Trending Markets: In strong trending markets, traders can focus on riding the trend using fractal-based breakout strategies. They may employ longer timeframes and use fractals to identify pullbacks for optimal entry points.
- Ranging Markets: During periods of consolidation or ranging markets, traders can use fractals to identify support and resistance levels. They can then trade within the defined range, buying near support and selling near resistance.
- Volatile Markets: In volatile markets, traders can be more selective with their entries and exits, relying on fractals to pinpoint moments of relative stability or clear direction amid the chaos.
- Stable Markets: In stable, low-volatility conditions, traders may need to be patient and wait for stronger fractal signals or combine fractals with range-bound strategies.
In essence, the key to success lies in the trader’s ability to adapt their fractal strategies to the ever-changing market landscape. By recognizing the shifting tides of market conditions, traders can tailor their approach to maximize opportunities and mitigate risks.
In conclusion, as traders ascend to the realm of advanced tips and best practices in fractal trading, they unlock the potential for greater accuracy, precision, and adaptability. Multiple timeframes provide a panoramic view of market trends, combining fractals with other technical indicators reinforces signals, and the ability to adapt to diverse market conditions ensures flexibility and resilience in the face of market dynamics. These advanced strategies are the hallmark of experienced traders who harness the full potential of fractals in their Forex trading journey.
Conclusion
In conclusion, fractal trading strategies offer a powerful toolkit for Forex traders. Understanding the concept of fractals and their application in analyzing price movements can significantly enhance one’s trading skills. By recognizing the importance of fractals in identifying trends, anticipating reversals, and implementing breakout strategies, traders can gain a competitive edge in the market.
As you embark on your journey in Forex trading, remember that practice and refinement of your skills are essential. Integrating fractal analysis into a comprehensive trading strategy can be a game-changer, allowing you to navigate the complex world of Forex with confidence. So, harness the power of fractals, explore their potential, and make informed trading decisions that lead to success in the ever-evolving world of currency trading.
Click here to read our latest article on Positive Momentum Trading

FAQs
- What is the primary purpose of fractal trading strategies in Forex? Fractal trading strategies in Forex are primarily used to identify trend reversals and breakout opportunities, helping traders make informed decisions in the currency market.
- How do fractals assist in identifying trend reversals? Fractals assist in identifying trend reversals by forming specific patterns, such as bullish and bearish fractals, which indicate potential shifts in market sentiment.
- What are some common characteristics of bullish fractal patterns? Bullish fractal patterns typically have the lowest low in the middle, surrounded by two lower lows and two higher lows, signaling a potential uptrend.
- How can traders use fractals to set entry and exit points for breakout trading? Traders can use fractals to set entry points by entering a long position when price breaks above a bullish fractal’s high or entering a short position when price breaks below a bearish fractal’s low.
- What is the significance of combining fractals with other technical indicators? Combining fractals with other technical indicators, such as moving averages or RSI, can enhance the accuracy of trade signals and reduce false positives.
- What role do multiple timeframes play in fractal analysis? Multiple timeframes provide a broader perspective on market trends and validate the validity of fractal signals, increasing the accuracy of analysis.
- How can traders adapt fractal strategies to different market conditions? Traders should adjust their fractal strategies based on market conditions, such as trending, ranging, volatile, or stable markets, to optimize their trading approach.
- What does a bearish fractal reversal pattern indicate? A bearish fractal reversal pattern suggests a potential end to a short-term uptrend and the initiation of a downtrend, guiding traders to consider short positions.
- What risk management techniques are important when using fractal-based strategies? Risk management techniques, including stop-loss orders and proper position sizing, are crucial to limit potential losses while maximizing profits when employing fractal-based strategies.
- How can traders validate bullish or bearish fractal signals with oscillators? Traders can validate fractal signals by confirming them with oscillators like the stochastic or RSI, which help assess market momentum and align signals with overbought or oversold conditions.
Click here to learn more about Fractal Trading Strategies

I’m Vinit Makol, and I write to make sense of the markets, from forex and precious metals to the macro shifts that drive them. Here, I break down complex movements into clear, focused insights that help readers stay ahead, not just informed.