


Introduction
Triangle patterns in forex are powerful indicators of mid-trend consolidation. As a forex trader, comprehending these patterns is crucial to making informed trading decisions. This guide explores the definition, importance, and variations of triangle patterns in the forex market.

Symmetrical Triangles
Symmetrical triangles are one of the most intriguing variations of triangle patterns in forex trading. This distinct formation, characterized by two converging trend lines on a chart, provides valuable insights into the market’s behavior during consolidation phases. The symmetrical triangle’s intriguing aspect lies in its neutral nature, as it reflects a temporary equilibrium between buyers and sellers, resulting in a pause in price movements.

As symmetrical triangles take shape, price movements seem to meander in a sideways direction, displaying a lack of dominant control from either buyers or sellers. This phase of indecision can leave traders eagerly anticipating the next move in the market. Despite the neutral appearance, astute analysts recognize the importance of considering the pre-existing trend while interpreting symmetrical triangles. The prevailing trend acts as a backdrop against which the symmetrical triangle forms, lending subtle hints about the potential direction of the forthcoming breakout.
Trading symmetrical triangles effectively requires careful observation and a keen eye for pattern recognition. Traders eagerly await the breakout moment, which offers a significant opportunity to capitalize on the ensuing price movement. While the symmetrical triangle itself does not offer a directional bias, it acts as a precursor, favoring the continuation of the prevailing trend. Thus, the breakout signals a potential continuation of the current market trend, prompting traders to enter positions in alignment with the dominant market sentiment.
Analyzing symmetrical triangles can be both an art and a science, requiring a blend of technical expertise and intuition. Traders must closely monitor the behavior of price within the triangle’s boundaries, observing for signs of market sentiment shifting. Technical indicators and oscillators can complement the analysis, providing supplementary confirmation of potential breakouts.
Trading Strategy for Symmetrical Triangles
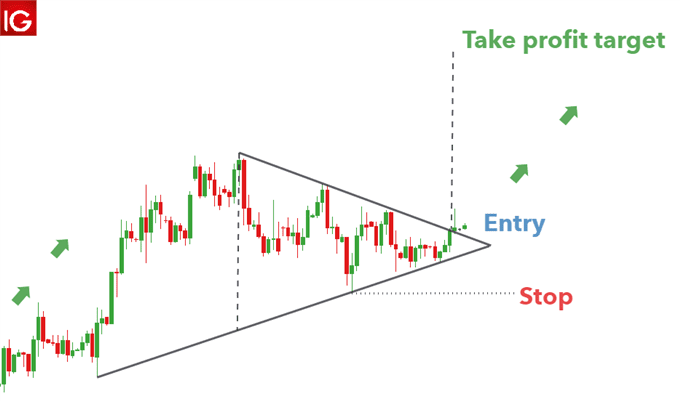
A well-executed trading strategy for symmetrical triangles revolves around a key technique – the measuring of breakouts. Traders eagerly utilize this technique to forecast potential target levels once the price escapes the confines of the symmetrical triangle. By measuring the vertical distance between the upper and lower trendlines at the triangle’s inception, traders gain valuable insights into the potential magnitude of the price move.
Taking the AUD/USD chart as an illustrative example, imagine a symmetrical triangle taking shape amidst an existing uptrend. Traders in this scenario would efficiently measure the triangle’s vertical distance, a critical step in preparing for the inevitable breakout. As the price surges beyond the symmetrical triangle’s boundaries, the pre-calculated measurement aids in predicting a take profit level. However, it is essential to exercise caution as finding the textbook symmetrical triangle is a rarity in the market. Imperfect patterns do not necessarily invalidate the trading strategy, as understanding the market’s message through price action remains the primary focus.
Successful implementation of the measuring technique requires patience and a comprehensive understanding of the market dynamics. Traders must remain vigilant, observing the price behavior leading up to the breakout and discerning the strength of the prevailing trend. Additionally, employing technical indicators and oscillators can provide supplementary confirmation, further solidifying the trading decision.
While the measuring technique offers valuable insights, traders must couple it with prudent risk management practices. Setting appropriate stop levels becomes crucial to mitigate the risk of a false breakout. By defining stop levels at strategic points, traders protect their positions and ensure a positive risk-to-reward ratio.

Ascending Triangle Patterns in Forex
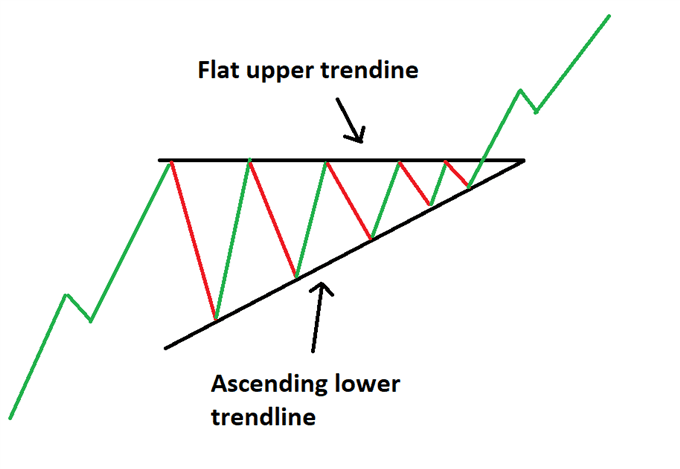
The ascending triangle pattern represents yet another intriguing variation of triangle patterns in Forex. While similar to the symmetrical triangle, it possesses its own distinct characteristics that make it a valuable asset for traders. With its flat upper trendline and a rising lower trendline, the ascending triangle captures the essence of an underlying bullish sentiment in the market.
When the ascending triangle starts taking shape, it reflects a scenario where buyers display greater aggression than sellers, causing the price to form a series of higher lows. This sequence of higher lows underlines the increasing demand for the asset, setting the stage for a potential breakout.
As the price nears the flat upper trendline, traders should maintain a watchful eye on the ascending triangle, as it may be a harbinger of a significant development. The likelihood of a breakout to the upside elevates, and this is where traders can capitalize on the opportunity to join the prevailing uptrend. The ascending triangle’s distinct structure and upward sloping lower trendline indicate that the buyers are gaining control, making it an appealing pattern for trend followers and momentum traders.
However, while the ascending triangle suggests the continuation of an existing uptrend, traders should not solely rely on this pattern. Other technical indicators and oscillators should be employed to validate the potential breakout. Combining the ascending triangle pattern with supporting indicators can offer added confirmation and strengthen the trading decision.
To successfully trade the ascending triangle pattern, it is crucial to adhere to prudent risk management practices. Setting appropriate stop levels and identifying an attractive risk-to-reward ratio are essential components of a well-thought-out trading plan. By managing risk effectively, traders can protect their capital and make the most of favorable trading opportunities presented by the ascending triangle pattern.
Trading Strategy for Ascending Triangle Patterns in Forex
A comprehensive and effective trading strategy for ascending triangle patterns involves the use of the measuring technique to gauge potential price movements. By measuring the vertical distance between the flat upper trendline and the rising lower trendline at the beginning of the triangle formation, traders can identify the magnitude of the potential breakout.
Once the ascending triangle pattern is established, traders can anticipate a breakout to the upside, given the pattern’s bullish implications. By applying the measured distance at the point of the breakout, traders can identify potential profit levels. The measured distance acts as a price projection tool, providing an estimation of how far the price may move after the breakout.
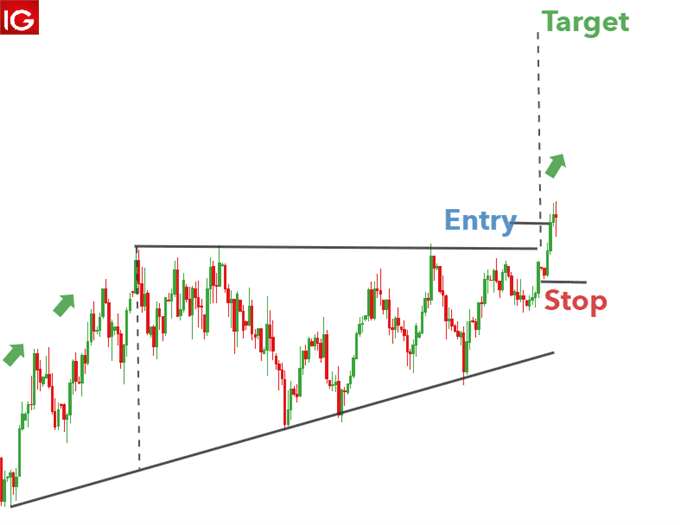
In the context of the US Dollar Index chart example, we can observe an ascending triangle forming amidst an existing uptrend. Traders analyzing this pattern can measure the vertical distance between the two trendlines and use it as a guide to set their take profit targets. The projected distance can help traders identify potential price targets where they can exit their trades profitably.
While utilizing the measured distance is a valuable technique, traders should not rely solely on this method. Technical analysis often works best when used in combination with other indicators and trading tools. Therefore, traders should consider additional factors, such as support and resistance levels, oscillators, and moving averages, to confirm the potential breakout.
Furthermore, risk management is crucial in any trading strategy, and the ascending triangle is no exception. Traders must set appropriate stop levels to mitigate downside risk and protect their capital. By placing a tight stop at a recent swing low or a suitable support level, traders can ensure that losses are limited if the price fails to follow the expected breakout direction.
Descending Triangle Patterns in Forex
Descending triangle patterns are another essential variation of triangle patterns in Forex. This pattern differs from both the symmetrical and ascending triangles as it features a descending upper trendline and a flat lower trendline. The descending triangle indicates that sellers are exerting more control than buyers, resulting in a series of lower highs.
As the price approaches the flat lower trendline, traders should be on the lookout for a potential breakdown. A strong break of the lower trendline can serve as a signal for traders to enter short positions. The breakdown suggests a potential continuation of the existing downtrend, making it an attractive opportunity for traders seeking to profit from downward price movements.

However, traders must exercise caution when trading the descending triangle pattern. While the breakdown offers a potential entry point for short trades, it is essential to implement appropriate risk management measures. Setting appropriate stop levels is crucial to manage risk effectively and protect capital. By placing a stop-loss order above the recent swing high or a suitable resistance level, traders can limit potential losses if the price unexpectedly reverses.
In addition to the breakout point, traders may consider the vertical distance of the triangle to project potential profit targets. By measuring the distance between the descending upper trendline and the flat lower trendline, traders can estimate the potential downward movement after the breakdown. This projection can be used to set take profit levels and manage reward potential relative to risk.
While descending triangle patterns in Forex offer promising trading opportunities, it is important to complement the analysis with other technical indicators and price action signals for confirmation. Traders may use oscillators, moving averages, and support and resistance levels to gain further insights into market sentiment and price movements.
Trading Strategy for Descending Triangle Patterns in Forex
When analyzing descending triangles, consider the GBP/USD chart example. The pattern emerges after a downtrend, with sellers outweighing buyers and pushing the price lower. Traders can benefit from a short position once the price breaks below the lower trendline.

Click here to learn more about Triangle Patterns in Forex
Trading with Triangle Patterns in Forex: Key Considerations
Trading with triangle patterns in forex requires careful consideration of key factors to enhance the effectiveness of trading strategies. The first step in utilizing triangle patterns in forex is to assess the direction of the trend before the consolidation period. Identifying the prevailing trend helps traders determine the potential direction of the breakout and the overall bias for their trades. By understanding whether the trend is upward or downward, traders can align their trading decisions with the broader market sentiment.
Drawing upper and lower trendlines to spot triangle patterns in forex is an essential technical analysis tool. These trendlines serve as visual guides, outlining the boundaries of the consolidation period. When the price approaches these trendlines, traders should be alert for potential breakouts. Upper trendlines act as resistance levels, while lower trendlines act as support levels. Monitoring price action around these trendlines provides valuable insights into market sentiment and potential breakout points.
Utilizing measuring techniques for target levels is a crucial aspect of trading triangle patterns in forex. Measuring the vertical distance between the upper and lower trendlines at the beginning of the triangle formation can help traders forecast the potential price movement after the breakout. This projection aids in setting appropriate take profit levels, allowing traders to capitalize on the price momentum following the breakout. Additionally, this technique assists in determining the reward potential relative to the risk, enabling traders to assess the trade’s attractiveness.
However, traders must also consider sound risk management practices to safeguard their capital. Triangle patterns in forex, like any other technical pattern, are not foolproof and may experience false breakouts. To mitigate potential losses from false signals, traders should implement appropriate stop-loss orders. Setting stop-loss levels above the upper trendline for short trades and below the lower trendline for long trades can help protect against unexpected reversals. Moreover, adhering to a positive risk to reward ratio is essential for overall trading success. A positive risk to reward ratio ensures that potential profits outweigh potential losses on each trade, increasing the likelihood of profitable outcomes over the long term.
Further Exploration of Forex Trading Patterns
In addition to triangle patterns in forex, there is a wide array of essential patterns that traders can explore in the dynamic world of forex trading. Continuation patterns play a vital role in identifying trends and potential breakouts within the market. Rising wedge, falling wedge, and pennant patterns are some of the most prominent continuation patterns that traders should be familiar with. Recognizing these patterns can provide valuable insights into the market’s current direction and its potential to continue the existing trend.
The rising wedge pattern is characterized by converging trend lines that slope upward. This pattern signals a potential reversal of the current trend as it indicates a loss of momentum in the upward movement. Traders should be vigilant when they encounter a rising wedge, as it may precede a bearish trend reversal, leading to potential selling opportunities.
On the other hand, the falling wedge pattern exhibits converging trend lines that slope downward. This pattern often appears in a downtrend and may indicate a potential reversal to an uptrend. Traders should closely monitor the formation of falling wedges, as they could present opportunities to capitalize on potential bullish breakouts.
The pennant pattern is another continuation pattern that resembles a small symmetrical triangle. It usually forms after a strong price movement and indicates a brief consolidation before the trend resumes. Recognizing pennant patterns can be advantageous for traders, as they signal potential continuation of the existing trend, providing potential entry points for trades in the direction of the trend.
Apart from continuation patterns, traders should also be well-versed in recognizing reversal patterns. These patterns, as the name suggests, indicate a potential reversal in the market’s direction. Among the prominent reversal patterns are the head and shoulders pattern, the morning star, and the evening star.
The head and shoulders pattern is a highly reliable and widely watched reversal pattern. It consists of three peaks, with the central peak (the head) being the highest, flanked by two smaller peaks (the shoulders) on either side. This pattern signals a shift in market sentiment, with a potential bearish trend reversal. Traders should closely monitor the completion of the head and shoulders pattern, as it can provide valuable entry points for short trades.
The morning star and evening star patterns are also essential for traders seeking reversal opportunities. The morning star appears after a downtrend and is characterized by a small-bodied candlestick followed by a larger bullish candlestick. This pattern indicates a potential trend reversal to the upside. Conversely, the evening star appears after an uptrend and comprises a small-bodied candlestick followed by a larger bearish candlestick. This pattern signals a potential trend reversal to the downside. Traders should pay close attention to these candlestick patterns, as they can offer valuable insights into market reversals.
Conclusion
Understanding triangle patterns in forex provides traders with valuable insights into mid-trend consolidation and potential breakouts. Employing trend analysis and breakout strategies can enhance trading decisions. Embrace the power of forex triangle patterns and explore other trading patterns to excel in the dynamic world of forex trading.
Click here to read our latest article on the History of Forex

FAQs
- What are triangle patterns in forex? Triangle patterns are consolidation patterns that occur mid-trend and signal a continuation of the existing trend.
- How do symmetrical triangles differ from other triangle patterns? Symmetrical triangles are neutral patterns that do not lean in any direction. However, they still favor the direction of the existing trend.
- What is the trading strategy for ascending triangles in forex? Traders can use the measuring technique to forecast appropriate target levels once the price breaks out of the ascending triangle.
- What is the significance of descending triangle patterns in forex? Descending triangle patterns indicate that sellers are more aggressive than buyers, causing prices to make lower highs.
- How should traders manage risk while trading triangle patterns in forex? Traders should implement sound risk management practices to mitigate the risk of false breakouts and ensure a positive risk to reward ratio on all trades.
- Apart from triangle patterns, what other trading patterns should traders explore? Traders should explore continuation patterns like rising wedge, falling wedge, and pennant patterns, as well as reversal patterns like head and shoulders, morning star, and evening star.
- How can understanding forex trading patterns enhance trading decisions? Understanding forex trading patterns helps traders identify potential breakouts and trends, making informed trading decisions.
- What are the benefits of using trendline analysis in forex trading? Trendline analysis helps identify various chart patterns, including triangles, allowing traders to spot potential opportunities for profitable trades.
- What is the significance of mid-trend consolidation in forex trading? Mid-trend consolidation, represented by triangle patterns, provides valuable insights into the market’s temporary pause before potentially continuing the existing trend. Traders can use this period to anticipate potential breakouts and make informed trading decisions.
- How can traders use triangle breakout strategies to their advantage? Triangle breakout strategies involve identifying key levels of support and resistance within the triangle pattern. Traders can plan their entry and exit points based on the breakout of these levels, maximizing the profit potential while managing risk effectively.