

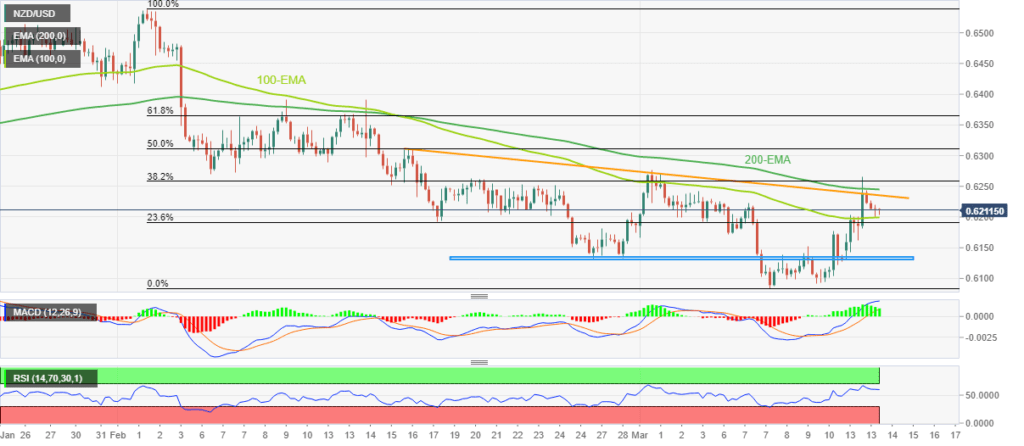
NZD/USD maintains its decline towards the intraday low and ends its two-day winning streak. The RSI retreat supports the Kiwi pair’s reversal from the 200-EMA, one-month resistance line. MACD signals’ declining positive bias and the inability to clear significant upward obstacles give sellers optimism.
Bears are drawn beyond the 100-EMA break by a two-week-old horizontal support region. The pair maintains modest losses at 0.6210 on Tuesday’s eve of the European session, the first negative day in three. In doing so, the Kiwi pair battles slow trading hours to breach the 100-bar Exponential Moving Average (EMA).
Nonetheless, the price increased significantly in nine weeks, the day before falling from 0.6265. The NZD/USD pair’s failure to surpass the 200-bar EMA and a downward-sloping resistance line from mid-February may be responsible for the retreat movements.
The RSI (14) decline from the overbought area and the declining positive bias of the MACD signals may support the pullback movements.

However, it’s essential to remember that for the NZD/USD bears to gain control, a clear negative breach of the 100-bar EMA, which as of press time, was at 0.6200, is required.
The possibility of a southward move into the two-week-old horizontal support zone at 0.6130 and the monthly low of 0.6084 cannot be discounted after that.
On the other hand, the 200-EMA and trend above the line limit the short-term NZD/USD rebound to levels at 0.6245 and 0.6230, respectively.
You can’t rule out the possibility of a rally toward the mid-February high of 0.6390 if NZD/USD stays stronger than 0.6245.
NZD/USD: Four-hour chart
Trend: Further decline is anticipated