

Trendline analysis is one of the most powerful yet underappreciated tools in trading. Many traders rely on complicated systems, but trendline analysis remains a simple and effective way to interpret price movement. It involves drawing straight lines on a chart to highlight the direction of the market. These lines help identify ongoing trends and provide key decision-making points for both entry and exit.
By drawing trendlines, traders can gain insights into the market’s psychology. Trendlines simplify price action and eliminate noise, offering a clear roadmap of what the market is doing. This technique plays a vital role in analyzing support and resistance levels, giving traders an edge in volatile environments. When used correctly, trendline analysis becomes one of the most reliable technical analysis tools in any trader’s arsenal.
Let’s explore how trendline analysis works, how to draw effective trendlines, and how this method fits into broader trendline trading strategies.

Understanding the Basics of Trendline Analysis
Trendline analysis begins by identifying important price points on a chart. Traders look for swing highs in a downtrend and swing lows in an uptrend. By connecting these points with a straight line, you can create a trendline that reveals the direction of the market.
Here’s how it works:
- In an uptrend, connect at least two higher lows.
- In a downtrend, connect at least two lower highs.
- Three or more touchpoints validate the trendline.
Once established, trendlines act as support in an uptrend and resistance in a downtrend. They guide traders by showing when prices may bounce or reverse.
For example, consider a EUR/USD daily chart where the price has consistently bounced off a rising trendline over several weeks. Each bounce offers a potential buy opportunity. These opportunities stem from the line acting as a support level. In this case, the trendline serves as both a guide and a barrier.
The beauty of trendline analysis is its versatility. You can apply it across all markets—Forex, stocks, crypto, or commodities. It works equally well on 5-minute charts and weekly charts.
Drawing Trendlines with Accuracy and Confidence
Drawing trendlines may seem straightforward, but accuracy is critical. A well-drawn trendline reflects the true strength and direction of a trend. A poorly drawn one can lead to costly errors.
To draw accurate trendlines, follow these steps:
- Identify clear swing highs and swing lows.
- Use at least three points to confirm a trendline.
- Avoid forcing lines to fit the price. Let the market define them.
Let’s say you’re analyzing the GBP/JPY pair on a 4-hour chart. You find three rising lows that form a clean ascending trendline. The market touches this line and bounces each time. This confirms the line’s validity as support.
Also, remember to extend your trendline beyond the last price point. Doing so helps forecast future support and resistance levels. This foresight makes drawing trendlines a core part of successful trendline trading strategies.
The slope of the trendline also matters. A steep trendline suggests strong momentum. A shallow one indicates a slower, more stable trend. Understanding this can help assess the strength of buyer or seller pressure in the market.
Trendline Trading Strategies That Work
Once you’ve mastered drawing trendlines, it’s time to apply them to trading strategies. Trendline analysis supports multiple approaches based on trend continuation, reversal, and breakout setups.
Here are three effective trendline trading strategies:
- Bounce Trading: Buy when the price touches a rising trendline in an uptrend. Sell when it touches a falling trendline in a downtrend.
- Breakout Trading: Watch for price breaking through a well-established trendline. This can indicate a trend reversal.
- Pullback Confirmation: Enter a trade after a breakout and a retest of the broken trendline. This confirms the breakout is not a false signal.
For example, in the AUD/USD market, if the price breaks a descending trendline and retests it from above, that level may act as support. This setup allows traders to go long with a tighter stop and clear target.
These trendline trading strategies combine risk management with precise timing. Trendline analysis supports these decisions by acting as a visual guide, helping traders identify favorable opportunities.

Support and Resistance Levels: How Trendlines Reveal Key Zones
Trendline analysis plays a crucial role in identifying support and resistance levels. These levels are where price often reacts, either bouncing or reversing.
Support is the area where price tends to stop falling and start rising. Resistance is where price stops rising and starts falling. Drawing trendlines helps identify these levels in a visual, intuitive way.
Let’s consider the USD/CAD chart. A descending trendline touches several lower highs, forming a strong resistance level. Every time price reaches this line, it struggles to break higher. Traders can use this insight to place sell orders near resistance.
Similarly, in a bullish scenario, an ascending trendline may offer multiple support points. When price pulls back to the trendline, traders anticipate a bounce and look for buying opportunities.
Support and resistance levels discovered through trendline analysis are more dynamic than static horizontal lines. They adapt with price movement, giving traders a real-time framework to trade effectively.
How Trendline Analysis Integrates with Technical Analysis Tools
Trendline analysis does not exist in isolation. It works best when used with other technical analysis tools. Combining tools improves the accuracy of trade setups and reduces false signals.
Popular tools to combine with trendlines include:
- Moving averages to confirm trend direction.
- RSI (Relative Strength Index) to measure momentum near trendlines.
- Volume indicators to validate breakouts.
- Fibonacci retracements to identify confluence zones.
Imagine using trendline analysis with RSI on the EUR/JPY chart. The price touches an ascending trendline while RSI shows oversold conditions. This confluence increases the likelihood of a bounce.
Using multiple technical analysis tools helps traders confirm their bias. It also sharpens entry and exit decisions. Trendline analysis provides the structure, while indicators offer deeper insights into market strength.
Real Examples of Trendline Analysis in Action
Let’s dive into practical applications to see trendline analysis in action. Real examples help reinforce the theory and show how powerful this method can be.
Example 1: DXY Index
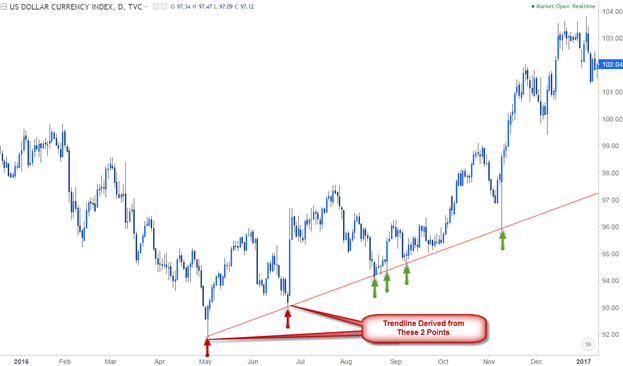
source:dfx
On the daily chart of the U.S. Dollar Index, a trendline drawn from key lows forms a strong support level. Each time the price retraces to this trendline, it rebounds. Traders looking to long the dollar use this line to enter with minimal risk.
This support and resistance level becomes crucial when deciding trade entries, especially during news-driven volatility.
Example 2: AUD/NZD
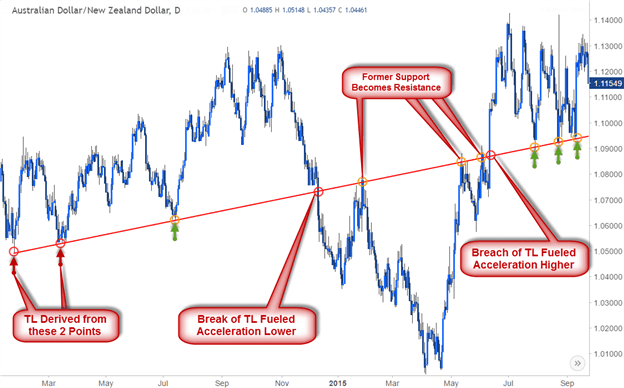
source:dfx
In the AUD/NZD pair, a broken upward trendline becomes a new resistance level. After the break, price retests the trendline from below and fails to move higher. This rejection offers a great short setup. Here, the trendline analysis helps switch bias from bullish to bearish.
These examples show how trendlines act as flexible zones. They can switch roles from support to resistance and vice versa, depending on price action.
Advanced Trendline Techniques for Better Accuracy
Once traders become confident in basic trendline analysis, they can explore advanced techniques. These methods improve accuracy and align trendlines with broader market context.
One advanced method is multi-timeframe analysis. This involves checking trendlines across different timeframes. For example, you may spot a downtrend on the 1-hour chart, but the daily chart shows a strong uptrend. Aligning trades with the higher timeframe trend adds conviction to your setup.
Another technique is using Andrews’ Pitchfork or median-line analysis. These tools build on trendline principles by drawing multiple lines around a central trend. They create channels that help identify hidden support and resistance levels.
Advanced techniques like these turn trendline analysis into a strategic advantage. They help traders spot trend shifts early and time their trades with precision.
Best Practices to Improve Your Trendline Trading Skills
To maximize the benefits of trendline analysis, follow these best practices:
- Always use at least three touchpoints to validate a trendline.
- Analyze the context of the trendline within the broader trend.
- Use trendlines in combination with technical analysis tools.
- Confirm breakouts with volume or a secondary indicator.
- Don’t force a trendline—if it doesn’t fit, redraw it.
Also, regularly review your trades. Look back at charts and study how trendlines played out. This reflection helps improve your drawing accuracy and decision-making.
Another tip: avoid trading solely based on trendline breaks. Wait for confirmation through retests or candlestick patterns. This reduces the chance of falling into false breakout traps.

Final Thoughts on Trendline Analysis
Trendline analysis is a timeless method that continues to serve traders in all market conditions. It simplifies complex price movements and offers clear guidance on trend direction. By drawing trendlines and identifying support and resistance levels, traders gain a visual edge in analyzing market behavior.
Unlike many technical analysis tools that rely on complex formulas, trendline analysis focuses on price action. This raw approach makes it universally accessible and reliable. Whether you’re a beginner or an experienced trader, trendlines belong in your trading toolkit.
With practice, trendline analysis becomes second nature. You’ll start spotting trendlines naturally and using them to craft high-probability setups. Remember, consistent success in trading lies in mastering the basics—and trendlines are as basic and powerful as it gets.
Click here to read our latest article What Are Forex Spreads? Fixed vs Variable Explained Simply