
WHAT IS IT?
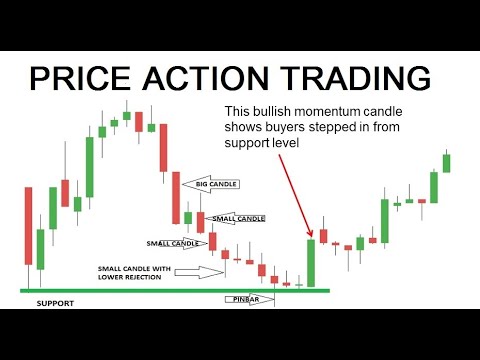
The study or analysis of price movement in the market is known as price action. It is a tool used by traders to generate views and make choices based on trends, important price levels, and effective risk management. The first stage in price action trading is typically trend identification.
Price action chart characteristics:
PRICE MOVEMENT AS YOUR PRIMARY INDICATOR
Price movement serves as the first kind of analysis for technical analysis setups. When employing an indicator, it is important to keep in mind that it is a function of price action. When it comes to trading, the indicator itself is not the most important instrument; rather, price action takes precedence. The information that the indicator will finally display on the chart is determined by price activity.
As a result, before examining the indicator for an entry signal, a trader must ascertain what the price action is doing (i.e., the trend). The trader may then check the indicator for an entrance signal in the trend’s direction after the trend has been identified. Since traders base their decisions on an instrument’s price movement, they pay more attention to price changes than indicator value changes.
Technical indicators are derived from price activity; as such, the information that they display on the chart is determined by price action. These metrics are determined utilising various periodic price data that serve as support for the entry, exit, and stop distance requirements. To determine how the market is operating on a broad scale, trend identification is crucial in market analysis (time frame dependent).
Example of price movement in USD/ZAR:
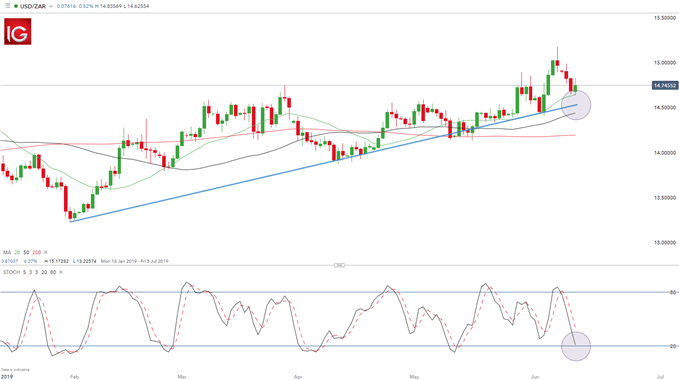
The USD/ZAR chart shows how price movement and technical indicators work together to provide a classic trade setup. The price action section of the chart is where the upward trend (blue line), which in this case also acts as a support level, is first identified. The inclusion of the moving average (MA) and the fact that the forex price is above the 20, 50, and 200 moving average lines further corroborate the direction of the short-term trend.
The stochastic oscillator indicates that the market is almost in oversold territory, pointing to further bullish/upward activity. In order to time the entry, it would be necessary to monitor both the stochastic and the direction of the price as it approaches the support (blue line). Traders would want to start a long position with proper risk management once the price hits this level.
SUMMARY
Price action is a wide technical analysis methodology that includes many trading approaches used by traders to study the markets. Price movement and technical indicators combine effectively to help traders make more precise trading selections.

I’m Vinit Makol, and I write to make sense of the markets, from forex and precious metals to the macro shifts that drive them. Here, I break down complex movements into clear, focused insights that help readers stay ahead, not just informed.