

Introduction
Within the intricacies of the forex market, a financial trading instrument known for its volatility, the Bearish Engulfing pattern emerges as a focal point of interest among traders and enthusiasts alike. Serving as a guiding light, the Bearish Engulfing pattern is touted to predict price reversals. This pattern is a pillar of technical analysis and remains crucial for interpreting the market’s price trend, shaping traders’ strategies and understanding the larger dynamics at play.
Background and Definition
As forex traders venture deeper into the world of charts and patterns, the Bearish Engulfing stands out with its unique visual representation. A candlestick pattern by nature, the Bearish Engulfing forms when a small bullish candle (representing an increase in price) is overshadowed by a subsequent larger bearish one (indicating a decrease in price). This new candle “engulfs” the previous day’s body, signaling potential shifts in the market momentum.
It’s this juxtaposition, especially at the climax of an uptrend, that suggests the possibility of an upcoming trend reversal. Mastery of this, and similar patterns, provides traders with a competitive edge, enabling them to adeptly interpret price trends and make informed decisions.
Research Methodology
Embarking on a deep exploration within the intricate world of forex, our goal was clear: to decipher the intriguing complexities tied to the Bearish Engulfing as a price reversal indicator. Recognizing the essential role that robust methodologies play in ensuring precise findings, our study harnessed an innovative automated detection strategy, which tirelessly combed through an expansive dataset of 37,000 candles encompassing a myriad of currency pairs.

With Price Reversals being pivotal moments in forex trading, understanding the reliability of indicators like Bearish Engulfing becomes paramount. The meticulous nature of our chosen strategy was not only aimed at volume but also depth. Every data point was scrutinized, ensuring we captured even the subtlest of nuances associated with the Bearish Engulfing pattern, from its early formation to its full manifestation. Through this method, we hoped to provide traders and technical analysts with valuable insights into when and why this particular financial trading instrument makes its mark in diverse trading scenarios.

Key Findings from the Analysis
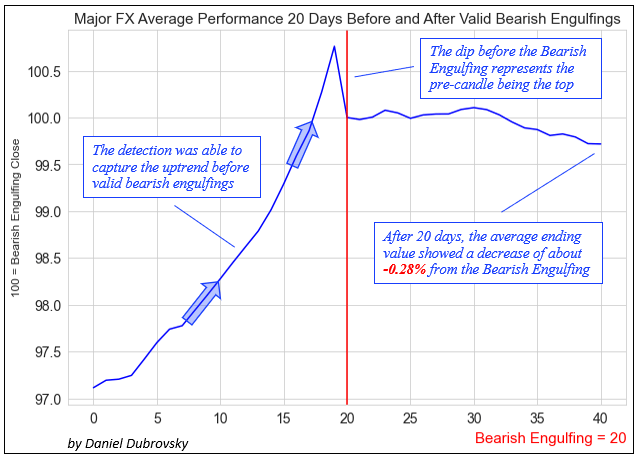
Delving into our comprehensive dataset, a tapestry of intricate patterns and trends intricately linked with the Bearish Engulfing began to unfurl. Our observations over a pivotal 20-day window—both leading up to and trailing a Bearish Engulfing event—offered a rich tableau of market dynamics. One of the most striking revelations was a distinct upward price trend just prior to the emergence of the engulfing pattern. Such consistent behavior bolsters the Bearish Engulfing’s credentials as a formidable price reversal indicator in the arena of technical analysis.
Yet, in the realm of forex, raw numbers often narrate tales that might elude a cursory glance. To decode these hidden narratives, we charted an average trend trajectory, casting a spotlight on the market’s pulse post-engulfing. This deep dive showcased a marked decline in prices following the unveiling of the Bearish Engulfing, painting a vivid picture of its influence as a financial trading instrument.
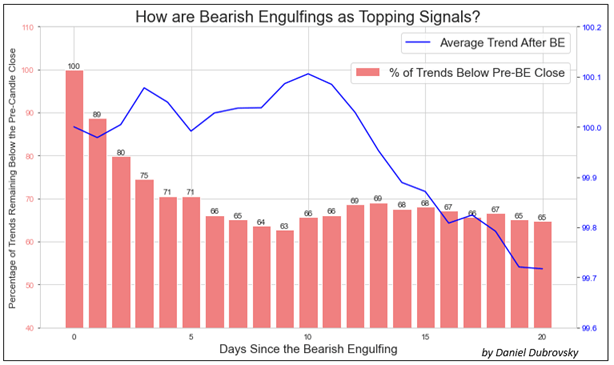
To further cement our understanding, we embarked on a journey to gauge the consistency of the Bearish Engulfing’s predictions. This was achieved by meticulously assessing the percentage of price trends that retreated below the starting candle across varied time spans. These analyses not only validated its predictive power but also hinted at the nuanced dance between Price Reversals and the Cumulative Distribution Function (CDF) in the ever-evolving forex theatre.
Bearish Engulfing Detection Rules
In the intricate realm of candlestick patterns, the Bearish Engulfing stands out for its straightforward yet revealing nature. The detection rules for this pattern are relatively simple. Firstly, it appears after an uptrend or at least a significant bullish candle. The primary characteristic to identify a Bearish Engulfing is that the body of the current candle must “engulf” or completely overshadow the previous day’s candle body, regardless of the shadows or wicks.

This means that the opening price of the current candle is higher than the previous candle’s close, and its closing price is lower than the prior candle’s open. When such a formation occurs, it is a strong indicator of a potential shift in sentiment, suggesting that the bears have overtaken the bulls. However, traders should approach this pattern with caution and use it in conjunction with other technical analysis tools to confirm its reliability.
Average Bearish Engulfing Trend
When we dissect the average Bearish Engulfing trend using the subsequent chart, it serves as a testament to the code’s accuracy in identifying the prior uptrend leading to the BE. Mirroring insights from an earlier analysis, this chart highlights a discernible peak just before the BE, subsequently dipping to the 100 mark, symbolizing the descent into the engulfing pattern. Following the emergence of the Bearish Engulfing, the trajectory tends to incline downwards, culminating in an average decline of -0.28% about 20 days post-BE. This data hints at a subtle bearish slant following the BE. However, while this downward bias is intriguing, it might not be the central insight gleaned from this examination.
Bearish Engulfing as a Topping vs. Reversal Signal
Navigating the turbulent waters of forex, traders perennially grapple with a pivotal conundrum: the role of the Bearish Engulfing. Is its core essence that of a harbinger, signalling the zenith of an upward journey, or does it play the more profound role of a herald, announcing the dawn of a downtrend in the price trend? At the intersection of these queries lies a nuanced understanding, one that our analysis sought to decipher.
While our data reinforced the idea that the Bearish Engulfing often emerges as a beacon of an impending peak in technical analysis, casting it definitively as a reversal indicator is a topic steeped in complexity. It’s akin to distinguishing between a fleeting sunset and the long night that follows. One hints at the culmination of the day, while the other signifies a transformation.
Delving into the mathematical realm, the CDF emerges as a formidable tool in this discussion. Acting as a lens, it magnifies the intricate dance of numbers post a Bearish Engulfing event. By meticulously charting the probabilities of varied price trajectories ensuing the pattern, this function not only enriches our comprehension of the Bearish Engulfing but also nuances our grasp on its potential ripple effects in the vast ocean of financial trading instruments.
Practical Implications for Traders
In the intricate tapestry of forex trading, patterns stand out like guiding stars, illuminating potential pathways and pitfalls. Among these, the Bearish Engulfing, backed by the might of technical analysis, can emerge as a potent compass, steering traders through choppy price trends and volatile waters. But, as with any navigational tool, its efficacy lies in its contextual application. Wise traders understand that no single pattern, no matter how consistent, offers a silver bullet. Instead, it complements a symphony of strategies, each contributing to a harmonized trading approach.
Forex trading, while grounded in numbers, is influenced by a whirlwind of externalities. Beyond the cold, hard data, real-world events like political shifts, global news, and macroeconomic tremors can send ripples across the market’s surface. These variables can, at times, overshadow or amplify the implications of a Bearish Engulfing, making it essential for traders to be attuned to the broader economic chorus.
And as we zoom out from the forex microcosm, another crucial insight surfaces: the universality (or lack thereof) of patterns. The forex realm, with its unparalleled liquidity and incessant movements, is its own beast. Patterns that manifest here, like the Bearish Engulfing, may wear different masks in the stock bazaar or the cryptocurrency jungle. Traders must, therefore, adapt and recalibrate, understanding that each market has its own rhythm and resonances. Thus, while the it remains a formidable ally, its true power unfolds only when wielded with discernment and an appreciation for the ever-evolving dance of market dynamics.
Conclusion
Navigating the labyrinthine world of forex trading is no small feat. Patterns, especially ones as significant as the Bearish Engulfing, serve as beacons, guiding traders through the tumultuous waters of the market. This investigation into its dynamics and implications adds another layer to the complex tapestry of forex trading. As research progresses and the market evolves, the quest for clarity continues, with each study aiming to empower traders with the knowledge and tools they need to thrive.
Click here to read our latest article on the Australian Dollar Fundamental Bias

FAQs
- What is Bearish Engulfing in forex trading? A Bearish Engulfing is a candlestick pattern that signals a potential reversal from an uptrend to a downtrend. It’s characterized by a smaller bullish candle being completely ‘engulfed’ by a subsequent larger bearish candle.
- How was the research on Bearish Engulfing conducted? An advanced automated detection strategy was used to analyze a dataset of 37,000 candles across various currency pairs, capturing nuances of the it’s appearance and impact.
- What were the key findings related to the Bearish Engulfing’s reliability as a price reversal indicator? There’s a notable uptrend before a Bearish Engulfing, reinforcing its potential as a price reversal indicator. Post-engulfing, there’s a pronounced dip in prices, but its reliability as a decisive reversal signal is still under discussion.
- How does Bearish Engulfing differ as a topping signal versus a reversal signal? While the it often hints at an impending peak (topping signal), its definitive role as a reversal signal, indicating the beginning of a downtrend, remains debated.
- How did the Cumulative Distribution Function aid in the study? The CDF helped in plotting the probabilities of various price trends following a Bearish Engulfing, offering a broader perspective on the pattern’s implications on price trends.
- What practical insights can traders derive from understanding the Bearish Engulfing pattern? Recognizing a Bearish Engulfing pattern, combined with robust technical analysis, can enhance trading strategies. However, traders should view it as one of many tools, always considering context and other market influences.
- Can patterns like Bearish Engulfing in forex be applied to other markets like stocks or cryptocurrencies? While the it is a valuable tool in forex, its implications might not directly translate to other markets due to different market dynamics, liquidity, and influences.
- Are there other variables that can influence the forex market? Yes, external factors such as global news, political shifts, and macroeconomic developments can impact the forex market and should be considered alongside patterns.
- How should traders use the Bearish Engulfing pattern in their strategies? While the it offers insights, it should be combined with other technical analysis tools, market research, and an understanding of broader economic events for a balanced approach.
- Is the Bearish Engulfing pattern always an indicator of a price downturn? Not always. While it often signals a potential price reversal, its reliability as a concrete reversal indicator is still up for discussion, and it’s essential to analyze it in the broader context of market dynamics.
Click here to know more about Bearish Engulfing Patterns