


Introduction: The Intersection of Bonds and Stocks
You might have heard of the yield curve, a term often thrown around in financial circles. But did you know that understanding yield curve regimes can give you an unparalleled edge in the stock market? This guide will demystify the concept and empower you to use yield curves as a robust tool for your investment strategies.
To grasp the significance of yield curves, it’s crucial to understand the basic relationship between bonds and stocks. Bonds are debt securities that pay periodic interest and return the principal amount at maturity. Stocks are shares in a company, offering a stake in its assets and earnings. Both markets are vast and multi-faceted, but they are more interconnected than most investors realize. Understanding one can yield insights (pun intended) into the other.
Understanding Yield Curve Regimes
The Concept of Yield Curve
At its core, a yield curve is a graphical representation of interest rates for bonds with similar credit quality but varying maturity dates. It’s a fundamental tool in finance that provides critical insights into the state of the economy and can serve as a powerful predictor of future economic trends.
The Traditional Yield Curve
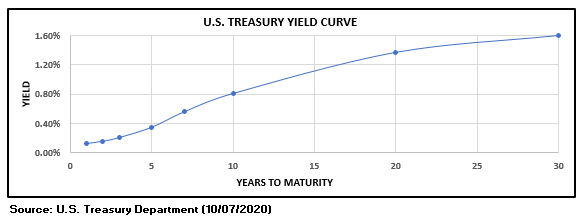
Traditionally, the yield curve exhibits an upward-sloping shape, which means that longer-term bonds tend to offer higher yields compared to their shorter-term counterparts. This upward slope is a reflection of a fundamental principle in finance: investors generally expect a higher return for tying up their money in longer-term investments. In other words, the longer you lend your money, the more compensation you should receive in the form of higher interest rates.
The Anomalies: Shifting, Flattening, and Inverting
While the traditional yield curve provides a valuable framework, it’s crucial to understand that the yield curve is not static. It can morph and transform due to a variety of factors, including changes in the broader economy, shifts in interest rates set by central banks, and fluctuations in investor sentiment.
Flattening Yield Curve: A Cautionary Tale
In the realm of finance, few phenomena are as closely scrutinized and debated as the flattening yield curve. This intriguing occurrence takes place when the once-substantial gap between short-term and long-term interest rates narrows significantly. In a flattening yield curve scenario, investors notice that longer-term bonds offer only marginally higher yields than their shorter-term counterparts. The implications of this shift are profound, often sparking vigorous discussions about economic conditions and the potential headwinds that lie ahead.
Economic Anticipation
The flattening yield curve often serves as a canary in the economic coal mine. When investors observe this phenomenon, they begin to speculate about the broader economic landscape. The narrowing gap between short and long-term interest rates implies a growing consensus among investors that the economy may be in for a period of slower growth. It’s akin to a collective pause, as if the financial world is bracing itself for an impending storm.
Signal of Caution
For investors, a flattening yield curve is akin to a flashing caution sign. It’s a signal that the road ahead may be a bit rocky. Historically, periods of yield curve flattening have often been followed by economic slowdowns or contractions. Investors interpret this shift as a sign that potential economic headwinds may be on the horizon. It prompts a cautious approach to investments, with many market participants adopting a defensive posture to safeguard their portfolios.
Inverted Yield Curve: The Recession Harbinger
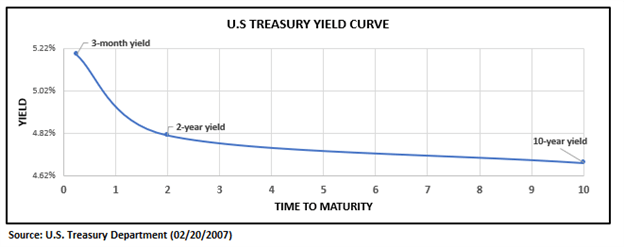
An inverted yield curve is a rare but dramatic occurrence in the financial world. It’s a moment when the short-term interest rates offered by bonds surpass the yields of their long-term counterparts. This phenomenon is not just attention-grabbing; it’s a reliable predictor of impending recessions.
Historical Omen
Investors have learned to heed the warning of an inverted yield curve. Historically, virtually every instance of an inverted yield curve has been followed by an economic recession. It’s as if the yield curve becomes a crystal ball, foretelling economic troubles on the horizon. The predictive power of the inverted yield curve is so profound that it is often described as one of the most reliable recession indicators in the financial world.
Cautious Approach
When the yield curve inverts, it sets off alarm bells for investors. It’s interpreted as a clear signal that economic troubles may be looming, prompting a cautious approach to investments. Investors often seek refuge in assets considered safe havens, such as government bonds, and may reduce their exposure to riskier assets like stocks. It’s a time when the financial markets collectively brace themselves for an impending economic storm.
Steepening Yield Curve: A Symphony of Optimism
On the flip side of the yield curve spectrum lies the steepening yield curve, a scenario that unfolds during periods of economic optimism. This is when the gap between short-term and long-term interest rates widens, and it’s regarded as a symphony of confidence in the future.
Economic Enthusiasm
A steepening yield curve is a resounding vote of confidence in the economy. Investors anticipate robust economic growth and a favorable business climate, leading to higher expectations for corporate earnings. It’s a time when the financial world hums with enthusiasm, and the stock markets tend to respond positively to such developments.
Bullish Sentiment
Investors often adopt a bullish sentiment during a steepening yield curve regime. They view the widening gap between short and long-term rates as a positive sign that the economy is on a strong footing. This optimism can translate into increased investments in equities, as stocks are seen as well-positioned to capitalize on the anticipated economic expansion.
In summary, these yield curve anomalies—flattening, inverted, and steepening—serve as essential tools for investors and economists alike. They provide critical insights into the ever-changing dynamics of the financial markets and serve as valuable signals for shaping investment strategies. Understanding these shifts can help investors navigate the complex terrain of economic cycles and make more informed decisions.
Understanding these anomalies in the yield curve is essential for investors. It’s not merely a chart but a dynamic indicator that reflects the ebb and flow of economic conditions and investor expectations. Being able to interpret these shifts can help you make more informed investment decisions and navigate the complexities of financial markets.
The Four Types of Yield Curve Regimes
Certainly, let’s expand on each of the four yield curve regimes, highlighting their significance and implications while keeping the keywords in mind.
Bear Steepener: Embracing Risk
Bear Steepener is a yield curve regime that attracts the attention of investors in search of opportunities. In this scenario, long-term interest rates rise at a faster rate than short-term rates. It’s like a green light for investors, signaling that it’s time to embrace risk and consider venturing into the stock market with confidence.
Risk-On Environment
Bear Steepener often occurs in what is known as a “risk-on” environment. This term suggests that investors are more willing to take on higher levels of risk because they believe the economic conditions are favorable. In such an environment, stock markets tend to flourish, and investors flock to equities with the expectation of substantial returns.
Favourable for Stocks
For those seeking growth in their portfolios, a Bear Steepener regime is a welcoming sight. It’s typically considered favorable for stocks, especially those in cyclical sectors like materials, industrials, and consumer discretionary. These sectors tend to thrive during Bear Steepener phases due to the expectation of faster earnings growth.
Bear Flattener: Navigating Expansion
Bear Flattener is another yield curve regime that warrants attention, especially during times of economic expansion. In this scenario, short-term interest rates rise at a faster pace than their long-term counterparts. While this might seem like a cause for concern, it’s important to note that it can still be favorable for stocks.
Expansion Phase
Bear Flattener often unfolds during the expansion phase of the economic cycle. This is a period characterized by robust economic growth, low unemployment, and increasing corporate profits. Despite the name, this regime can be seen as a sign that the economy is on solid ground.
Stocks Still Shine
During a Bear Flattener regime, stocks can still shine. Investors often find comfort in the fact that the economy is expanding, which can bolster stock market performance. Tech stocks and real estate investments, in particular, tend to perform well in this environment, benefiting from the overall positive sentiment and growth prospects.
Bull Steepener: Seeking Safety
Bull Steepener is a yield curve regime that emerges during times of economic uncertainty. In this scenario, short-term interest rates decrease more rapidly than long-term rates. It’s a sign that investors are seeking safety amid a potentially rocky economic landscape.
Risk-Off Situation
Bull Steepener indicates a “risk-off” situation, where investors become more cautious due to uncertainties in the economic outlook. During these periods, the stock market may face headwinds, and investors tend to look for safer investment options.
Caution Required
While Bull Steepener may not be the most favorable scenario for stocks, it’s essential for investors to exercise caution. Defensive sectors such as utilities and consumer staples tend to outperform during this phase, providing stability to investment portfolios. Technology and materials sectors may struggle, reflecting the overall sense of caution in the market.
Bull Flattener: Preparing for Turbulence
Bull Flattener is a yield curve regime that arises when long-term interest rates decrease more than short-term rates. This regime often unfolds during the late stages of the business cycle when investors start pricing in the possibility of a recession and disinflation.
Turbulence Ahead
Bull Flattener is like a warning bell for investors. It suggests that turbulence may be on the horizon, and it’s time to prepare for potential economic challenges. Investors often become more risk-averse during this phase.
Diversifying Portfolios
In a Bull Flattener regime, equity investors begin to tilt their portfolios towards higher-quality investments as a hedge against rising volatility. Staples and utilities typically command leadership during these periods, while cyclicals, like technology and materials, may underperform as corporate earnings for economically sensitive sectors weaken.
In summary, each of these yield curve regimes offers unique insights into the market environment. Bear Steepener and Bear Flattener are often seen as favorable for stocks, while Bull Steepener and Bull Flattener indicate times of caution and preparation. Understanding these regimes can help investors make informed decisions and adapt their portfolios to the prevailing economic conditions.
Yield Curve Regimes and Economic Indicators
A Deep Dive into Economic Indicators
Now that you understand the four key yield curve regimes, let’s explore their relationship with important economic indicators. Economic indicators are statistical metrics that show the direction of economic activities. Popular economic indicators include GDP, unemployment rate, and inflation.
The Yield Curve and GDP
The yield curve, with its ability to reflect investor sentiment and economic expectations, is akin to an economic barometer. It captures the collective wisdom of market participants, and one of the key metrics it aligns with is Gross Domestic Product (GDP).
Understanding GDP
Gross Domestic Product (GDP) is a fundamental economic indicator, representing the monetary value of all goods and services produced within a country’s borders over a specific period. It serves as a comprehensive gauge of an economy’s health and vitality. A rising GDP typically signifies a flourishing economy, characterized by increased production, consumer spending, and business activity.
The Steepening Effect
When an economy is on an upward trajectory, experiencing robust growth, and generating a rising GDP, it sets in motion a chain reaction in the financial markets. One of the notable effects is the steepening of the yield curve.
Bear Steepener and Bull Steepener Regimes
During periods of economic expansion, two yield curve regimes tend to become more prevalent: Bear Steepener and Bull Steepener. These regimes share a common characteristic—the steepening of the yield curve. This is where the connection between GDP and the yield curve becomes particularly intriguing for investors.
Bear Steepener: Riding the Wave of Growth
In the context of GDP, a Bear Steepener regime is like riding the wave of economic growth. As GDP rises and the economy expands, long-term interest rates often increase at a faster rate than short-term rates. This phenomenon contributes to a steepening yield curve.
Bull Steepener: Finding Safety in Growth
On the other hand, a Bull Steepener regime occurs when economic conditions are uncertain or deteriorating. In such situations, investors seek safety in long-term government bonds, causing long-term interest rates to decrease more slowly than short-term rates. This, too, results in a steepening yield curve.
Bullish Signs for Stocks
Both Bear Steepener and Bull Steepener regimes can be seen as bullish signs for the stock market. In the former, the confidence in economic growth bolsters investor sentiment, while in the latter, the demand for safer assets keeps long-term rates relatively higher. In both scenarios, the stock market tends to respond positively, as investors view the economic outlook with optimism.
Strategies for Investors
For investors, understanding the interplay between the yield curve and GDP can be a valuable tool. It offers insights into the broader economic landscape and can help shape investment strategies. During periods of rising GDP and the associated steepening of the yield curve, investors may consider increasing their exposure to equities, particularly sectors that thrive in growth environments.
However, it’s essential to remain vigilant and recognize that economic conditions can change. The yield curve can shift, and investors should adapt their strategies accordingly. While a steepening yield curve can be a bullish sign, it’s crucial to monitor other economic indicators and market trends to make informed investment decisions.
Unemployment Rates and the Yield Curve
Unemployment rates serve as a critical indicator of an economy’s well-being. They provide valuable insights into the balance between labor supply and demand, and their correlation with the yield curve offers a fascinating perspective on economic dynamics.
Low Unemployment Rates: A Sign of Prosperity
Low unemployment rates are typically seen as a harbinger of economic prosperity. When a significant portion of the workforce is employed, it signifies a strong economy where people have jobs, incomes, and purchasing power. This, in turn, fuels consumer spending, drives business expansion, and contributes to a positive economic outlook.
The Perils of Overheating
However, like any economic metric, extremes can bring their own set of challenges. When unemployment rates drop to exceptionally low levels, it can be a double-edged sword. On one hand, it reflects a robust job market and financial stability. On the other hand, it can signal an overheating economy.
Inflationary Pressures
An overheating economy, characterized by too low unemployment rates, can lead to rising inflationary pressures. As businesses compete for a limited pool of available workers, wages tend to rise. This increase in labor costs can get passed on to consumers in the form of higher prices for goods and services. Central banks, tasked with controlling inflation, may respond by raising interest rates to cool down the economy.
The Flattening Yield Curve
Here’s where the yield curve comes into play. When central banks increase short-term interest rates to combat inflationary pressures, it can lead to a flattening yield curve. This phenomenon often indicates a shift towards either the Bear Flattener or Bull Flattener regimes, depending on market dynamics.
Bear Flattener: A Sign of Caution
In the context of low unemployment rates and rising interest rates, a Bear Flattener regime may emerge. This signals a shift towards caution in the stock market. While economic growth may still be present, the tightening of monetary policy can create headwinds for equities.
Bull Flattener: Navigating Economic Challenges
Conversely, a Bull Flattener regime can also materialize. This regime suggests that the economy may be facing challenges, and investors are seeking safety in long-term bonds. It implies that despite low unemployment rates, there are concerns about economic stability and growth.
Caution in Stock Market Investments
Both Bear Flattener and Bull Flattener regimes serve as cautionary signals for stock market investments. In the former, it’s a reminder that economic conditions can change quickly, and the stock market may face headwinds. In the latter, it indicates that despite low unemployment rates, there are underlying concerns that warrant careful consideration.
Strategies for Investors
For investors, the relationship between unemployment rates and the yield curve underscores the importance of a balanced and adaptable approach. While low unemployment rates may signal economic strength, it’s essential to recognize the potential risks associated with overheating.
Investors should keep a close eye on central bank actions and inflationary trends, as these can influence the shape of the yield curve. A flattening curve should prompt a review of investment portfolios, with a focus on diversification and risk management.
How Inflation Affects the Yield Curve
Inflation, the gradual increase in the general level of prices for goods and services, is a fundamental economic force that can wield considerable influence over the financial landscape. Its interplay with the yield curve is particularly intriguing, as it can have significant implications for both investors and policymakers.
High Inflation: Stirring the Pot
When inflation surges, it sets off a series of reactions throughout the economy. As prices rise, consumers’ purchasing power erodes, and businesses may pass on higher costs to customers. In response to mounting inflationary pressures, central banks often take action by raising short-term interest rates. This monetary policy move aims to cool down an overheating economy and keep inflation in check.
The Steepening Effect
Here’s where the yield curve comes into play. In an environment of high inflation and rising interest rates, the yield curve often tends to steepen. This means that long-term interest rates rise at a faster rate than short-term rates. This shift can push the yield curve towards steepening regimes, such as the Bear Steepener or Bull Steepener.
Bear Steepener: Economic Growth Amid Inflation
In the context of high inflation, a Bear Steepener regime may emerge. This regime signifies that despite inflationary pressures, investors have confidence in the economy’s growth prospects. The anticipation of continued economic expansion can bolster stock market performance, and investors may flock to equities in search of returns that outpace inflation.
Bull Steepener: Seeking Safety Amid Inflation
Conversely, a Bull Steepener regime can also materialize during high inflationary periods. This suggests that while inflation is a concern, there may be broader economic uncertainties at play. In such cases, investors may seek safety in long-term government bonds, which can keep long-term interest rates relatively higher.
Low Inflation: Flattening Dynamics
On the other end of the spectrum, when inflation remains subdued, it tends to exert a different influence on the yield curve. Low inflation can lead to a flattening yield curve, characterized by a narrower gap between short-term and long-term interest rates. This flattening effect can push the yield curve towards flattening regimes, such as the Bear Flattener or Bull Flattener.
Bear Flattener: Caution Amid Low Inflation
In a Bear Flattener regime during low inflation, investors may exercise caution. The narrowing yield curve implies that despite low inflation, there may be concerns about the broader economic landscape. It can be seen as a signal to approach stock market investments with care.
Bull Flattener: Navigating Economic Challenges
A Bull Flattener regime during low inflation suggests a cautious approach amid economic challenges. Despite subdued inflation rates, underlying economic uncertainties may prompt investors to seek safety in long-term bonds.
Implications for Investors
For investors, understanding the relationship between inflation and the yield curve is essential for navigating the complex terrain of financial markets. High inflation can present opportunities in a Bear Steepener regime, where economic growth prevails. Conversely, low inflation may signal a need for caution in both Bear Flattener and Bull Flattener regimes.
Investors should remain vigilant, monitor inflation trends, and consider how central banks respond to inflationary pressures. Adjusting investment portfolios to align with the prevailing yield curve dynamics can help mitigate risks and capitalize on opportunities in an ever-changing economic landscape.

Leveraging Yield Curve Insights for Investment Strategies
Stock Market Sectors and Yield Curve Regimes
The yield curve isn’t just a financial indicator; it can also serve as a compass for investors, pointing them towards the stock market sectors that are likely to thrive in different business cycles. By understanding the prevailing yield curve regime, investors can make more informed decisions about where to allocate their capital within the stock market.
Bear Steepener: A Call for Cyclical Sectors
During a Bear Steepener regime, where long-term interest rates rise faster than short-term rates, investors often find opportunities in cyclical sectors. These sectors are closely tied to economic growth and tend to perform well when the economy is on an upswing.
Materials Sector
One such sector is materials, which includes companies involved in the production of basic materials like metals, chemicals, and construction materials. When the yield curve steepens, it’s often a sign of economic optimism. Investors in the materials sector anticipate increased demand for raw materials as construction and manufacturing activities pick up.
Industrials Sector
Similarly, the industrials sector tends to shine during a Bear Steepener regime. This sector encompasses companies involved in manufacturing, aerospace, defense, and transportation. Economic expansion typically leads to higher demand for industrial goods and services, translating into strong performance for these companies.
Bull Flattener: Seeking Defensive Sectors
Conversely, during a Bull Flattener regime, when long-term interest rates fall faster than short-term rates, investors may opt for a more cautious approach. This often leads to a shift towards defensive sectors that are less sensitive to economic fluctuations.
Utilities Sector
The utilities sector, which includes companies involved in electricity, gas, and water supply, is a common choice during Bull Flattener regimes. Utilities are considered defensive because their demand tends to remain relatively stable regardless of economic conditions. Investors seek the stability of utility stocks during uncertain times.
Consumer Staples Sector
Another defensive sector to consider during a Bull Flattener regime is consumer staples. This sector encompasses companies that produce essential goods like food, beverages, and household products. These items are necessities, and demand for them tends to remain constant, making consumer staples stocks a reliable choice in times of economic uncertainty.
Crafting a Sectoral Strategy
Understanding the yield curve’s influence on stock market sectors empowers investors to craft a more strategic approach to their portfolios. By aligning sectoral investments with the prevailing yield curve regime, investors can potentially capitalize on market trends and mitigate risks.
However, it’s crucial to remember that the yield curve is just one piece of the puzzle. Investors should consider a holistic approach to portfolio management, taking into account other economic indicators, company fundamentals, and their individual risk tolerance.
Strategies for Different Yield Curve Regimes
Investors who understand the dynamics of yield curve regimes can navigate the financial landscape with greater precision. Each regime presents unique opportunities and challenges, and crafting a well-informed investment strategy is key to success.
Bear Steepener: Embrace Growth
During a Bear Steepener regime, where long-term rates increase faster than short-term rates, investors may want to embrace growth-oriented sectors:
Materials Sector
Materials companies, involved in the production of basic materials like metals and chemicals, often flourish in this phase. Economic expansion boosts demand for raw materials, benefiting materials companies.
Industrials Sector
Industrials companies, including those in manufacturing and transportation, thrive when the economy is on an upswing. Increased economic activity drives demand for industrial goods and services.
Financials Sector
The financials sector, encompassing banks and financial institutions, can also be a wise choice during a Bear Steepener regime. These institutions often benefit from a steeper yield curve, which can enhance their profit margins.
Bear Flattener: Seek Stability
In a Bear Flattener regime, where short-term rates increase more than long-term rates, investors often turn to sectors that offer stability and resilience:
Technology Sector
Tech stocks tend to perform well in this regime. Technology companies are often less sensitive to interest rate changes and economic fluctuations, making them a favorable choice when yield curve flattening occurs.
Real Estate Investments
Real estate investments, such as real estate investment trusts (REITs), can also be attractive. These investments often provide steady income streams, making them appealing during periods of economic caution.
Bull Steepener: Defensive Posture
During a Bull Steepener regime, where short-term rates decrease more than long-term rates, investors may adopt a more defensive posture:
Utilities Sector
The utilities sector, known for its stable cash flows, can be a prudent choice during a Bull Steepener regime. Utilities tend to perform well when interest rates are falling.
Consumer Staples Sector
Consumer staples companies, producing essential goods, are another defensive option. These companies often enjoy consistent demand, irrespective of broader economic conditions.
Bull Flattener: Exercise Caution
In a Bull Flattener regime, where long-term rates decrease more than short-term rates, investors should exercise caution:
High-Quality Stocks
Consider focusing on high-quality stocks with strong fundamentals and reliable earnings. These stocks may provide stability in an environment of economic uncertainty.
Diversification
Diversify your portfolio by exploring non-equity assets, such as bonds or alternative investments. Diversification can help spread risk and provide a safety net during market turbulence.
Adapting to Change
It’s important to note that yield curve regimes are not static, and economic conditions can evolve. Investors should regularly monitor the yield curve, economic indicators, and market trends to adapt their strategies accordingly. A well-diversified portfolio that aligns with the prevailing yield curve dynamics can help investors navigate the complexities of the financial markets.
The Pitfalls of Relying Solely on the Yield Curve
The yield curve is undeniably a valuable tool for investors and economists alike. Its ability to provide insights into economic conditions and potential market trends is unmatched. However, it’s crucial to remember that while the yield curve can be a guiding star, it should not be the sole beacon of light in the vast sea of financial markets.
The Complex Web of Market Variables
Financial markets are a complex web of interrelated variables and factors. Market conditions are influenced by a multitude of economic indicators, geopolitical events, corporate earnings, and investor sentiment, among other things. Relying solely on the yield curve to make investment decisions can be akin to navigating a ship with a single star as your guide. It might provide a sense of direction, but it doesn’t account for the many other celestial bodies in the sky.
The Need for a Balanced Approach
A balanced approach to investing is essential for success. While the yield curve can offer valuable insights into the future direction of interest rates and the broader economy, it should be considered alongside a broader set of market indicators and trends. Here are a few reasons why:
Economic Variables
- Unemployment Rates: As mentioned earlier, low unemployment rates can be a sign of economic strength but can also signal overheating. A comprehensive view of economic indicators is needed to gauge the overall health of the job market.
- Inflation: Inflation trends play a significant role in shaping market conditions. Monitoring inflation rates, along with the yield curve, provides a more complete picture of economic dynamics.
Geopolitical Events
Global Events: Geopolitical events, such as trade tensions, political instability, or international conflicts, can have profound effects on financial markets. These events are not captured by the yield curve alone.
Market Sentiment
Investor Sentiment: Market sentiment can swing dramatically based on news, rumors, or social media trends. Understanding the psychology of investors and sentiment indicators is crucial for anticipating market moves.
The Art of Diversification
Diversification is another critical component of a balanced investment strategy. Spreading investments across various asset classes, such as stocks, bonds, real estate, and alternative investments, can help mitigate risks associated with any single market indicator or trend.
Asset Allocation
- Stocks: Equities provide opportunities for capital appreciation but come with volatility. The choice of sectors within the stock market should align with the prevailing economic conditions, as indicated by the yield curve and other factors.
- Bonds: Fixed-income securities, including bonds, can provide stability and income. The yield curve can guide bond selection, but credit quality and interest rate risk should also be considered.
Risk Management
Alternative Investments, Assets like real estate, commodities, and alternative investments can further diversify a portfolio. These assets may respond differently to market conditions, offering risk mitigation benefits.
The Path to Informed Decisions
In conclusion, while the yield curve is a powerful tool for understanding economic dynamics and making informed investment decisions, it should not be used in isolation. Investors should adopt a holistic approach that considers a wide range of variables, market indicators, and asset classes.
By doing so, investors can navigate the complex world of financial markets with greater confidence, adapt to changing conditions, and make well-rounded investment choices that align with their financial goals and risk tolerance.
Conclusion
| Key Takeaway | What It Means for You |
|---|---|
| Recognize Yield Curve Regimes | Enhance your understanding of the market and optimize your investment strategies. |
| Link Regimes to Economic Indicators | Use regimes to gain insight into larger economic trends. |
| Diversify Investment Strategies | Don’t rely solely on the yield curve; incorporate other tools and analyses for a balanced portfolio. |
Understanding and leveraging the key yield curve regimes can significantly enhance your investment strategies and potentially lead to greater financial success. By identifying the current regime, linking it to broader economic indicators, and adapting your investment strategies accordingly, you can navigate the complexities of the stock and bond markets more effectively.
Click here to read our latest article on Optimizing Your Trading Journal

FAQs
What is a Yield Curve Regime? A Yield Curve Regime refers to the prevailing shape and movement of the yield curve, indicating the relationship between short-term and long-term interest rates.
How many types of Yield Curve Regimes are there? There are four primary Yield Curve Regimes: Bear Steepener, Bear Flattener, Bull Steepener, and Bull Flattener.
What does a Bear Steepener regime signify for investors? A Bear Steepener regime indicates an economic upswing and is favorable for sectors like materials, industrials, and financials.
Which sectors tend to perform well during a Bear Flattener regime? Tech stocks and real estate investments often perform well during a Bear Flattener regime.
In a Bull Steepener regime, which sectors are considered suitable for investment? Defensive sectors like utilities and consumer staples are often chosen during a Bull Steepener regime.
What is the significance of a Bull Flattener regime for investors? A Bull Flattener regime suggests caution, and investors may focus on high-quality stocks and diversify into non-equity assets.
How does the yield curve relate to Gross Domestic Product (GDP)? A rising GDP often leads to yield curve steepening, which can be seen as a bullish sign for the stock market.
What happens to the yield curve in the presence of low unemployment rates? Low unemployment rates can lead to yield curve flattening, signaling potential economic headwinds and caution in stock market investments.
How does inflation affect the yield curve? High inflation often results in a steepening yield curve, while low inflation tends to flatten the curve.
Why should investors not rely solely on the yield curve for investment decisions? The yield curve is a valuable tool but should be used alongside other market indicators and trends to account for the complexity of financial markets.
Click here to learn more about Yield Curves

I’m Vinit Makol, and I write to make sense of the markets, from forex and precious metals to the macro shifts that drive them. Here, I break down complex movements into clear, focused insights that help readers stay ahead, not just informed.