

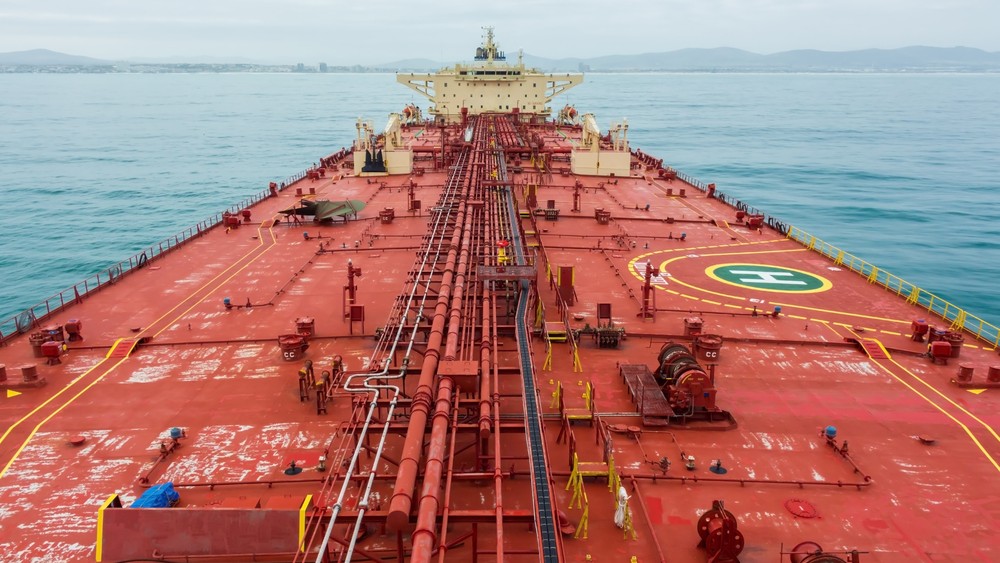
The oil price currency correlation is roaring back into view as tanker traffic through the Strait of Hormuz slows to a trickle. Only five commodity vessels crossed the strait on Saturday, with none scheduled for Sunday, according to Kpler data cited by Reuters. That compares with 31 tankers the previous weekend. Brent crude briefly broke above $89 per barrel before settling near $88.62, while WTI traded around $82.18. For currency traders, this is not just an energy story. It is a stress test for a handful of currency pairs that are unusually sensitive to crude supply shocks right now.

Why the Oil Price Currency Correlation Matters Now
Roughly a fifth of global oil supply transits Hormuz. When traffic collapses, even temporarily, markets price in a persistent risk premium rather than a one-off spike. That premium bleeds into FX because currencies reflect trade balances, terms of trade, and central bank reaction functions. Therefore, a sustained Hormuz disruption doesn’t just move energy futures; it reshuffles capital flows across G10 and emerging-market currencies simultaneously.
Importantly, the current move is being reinforced by multiple factors at once: Iran’s foreign minister ruling out near-term talks, President Trump warning Americans to accept higher gasoline prices, and reports of dark-fleet tankers running with transponders off. Each of these adds a layer of uncertainty that traders must price separately from the pure supply numbers.
Which Pairs Are Moving, and In Which Direction
Commodity Currencies: CAD and NOK Gain Support
The Canadian dollar and Norwegian krone typically strengthen when oil prices rise, since both economies are major net exporters. USD/CAD should therefore face downward pressure as long as Brent holds above the mid-$80s, though the greenback’s own safe-haven bid can offset some of that. NOK tends to show a cleaner beta to Brent specifically, making EUR/NOK a purer expression of the oil price currency correlation for traders who want less USD noise in the trade.
Asian Importers Under Pressure
On the other side, the Japanese yen, Indian rupee, and South Korean won face headwinds. These economies import the overwhelming majority of their crude, so higher oil prices worsen their trade balances and add imported inflation. USD/INR and USD/KRW have historically drifted higher during Hormuz-related spikes, and this episode looks no different, especially as Indian refiners scramble for spot barrels. Meanwhile, USD/JPY is more complicated because yen safe-haven flows can partially cancel out the import-cost drag, but sustained $90-plus Brent tends to tilt the balance toward yen weakness over a multi-week horizon.
The Dollar’s Dual Role
The US dollar itself sits in an unusual position. Higher oil prices normally support the dollar through terms-of-trade effects, given America’s shale buffer, a dynamic explored in depth in our US Oil Supply Shock FX analysis. However, geopolitical risk premiums also drive haven demand into the dollar independently of energy fundamentals. As a result, DXY strength during this episode is likely overdetermined, making it harder to isolate the pure oil channel from the fear channel.
Who Benefits From This Positioning
Macro funds running long NOK or long CAD against short Asian FX baskets stand to benefit most directly from the current setup. Exporter-economy central banks, particularly Norway’s Norges Bank, gain policy flexibility as energy revenues cushion fiscal balances. Conversely, the Reserve Bank of India and Bank of Korea face a tougher trade-off: they must weigh currency defense against growth support, since aggressive rate hikes to protect the currency would compound the drag from expensive imported crude.
Speculative traders who built short-oil positions on hopes of a US-Iran resolution have been squeezed hard over the past two weeks, and that squeeze has spilled directly into FX crosses tied to petro-currencies. This is a textbook case of cross-asset positioning feeding back into spot FX volatility, a theme we’ve tracked closely in our coverage of Hormuz Tanker Strikes FX.

Key Caveats and Risks
Dark-Fleet Data Distorts the Picture
Bloomberg has reported that tankers moving with transponders off are keeping a lid on prices, meaning the official Kpler figures likely understate actual flows. This matters enormously for FX traders, because it suggests the headline “traffic to a trickle” narrative may overstate the physical supply disruption. If real flows are healthier than reported, the risk premium currently embedded in NOK, CAD, and Asian FX crosses could unwind quickly once verified data emerges.
Inventory Data Cuts Both Ways
A surprise build in US crude inventories, confirmed by API data, has already capped some of the upside in oil prices. Consequently, the currency moves described above are not linear or guaranteed; they depend on whether physical supply data continues to validate the geopolitical risk narrative.
Position Sizing Matters More Than Direction
Given the volatility swings possible in NOK, INR, and KRW pairs right now, getting the trade direction right is only half the battle. Traders should use a position-sizing calculator approach to manage exposure, since headline risk from Iran or the Houthis can reverse intraday moves within minutes. A resolution announcement, even a partial one, could snap the oil price currency correlation into reverse just as fast as it formed.

Bottom Line
The Hormuz slowdown is a live case study in how energy supply shocks transmit into currency markets. NOK and CAD longs, funded against short Asian importer currencies, capture the cleanest expression of this theme. However, dark-fleet uncertainty, inventory surprises, and the dollar’s dual safe-haven/terms-of-trade role mean this is a high-conviction but high-volatility trade. Traders should stay nimble and watch tanker data closely before adding to positions.
Source: OilPrice
</markdown>

I’m Vinit Makol. With 20+ years in forex and financial markets, I serve as lead analyst at Edge-Forex, covering currency markets, macroeconomics, trading strategies, and market-moving events to give traders practical insights they can actually use.