Silver Fear and Greed Index: Live Reading and How to Use It
Silver Mood from Edge Forex: today's silver fear and greed index (0 to 100), what it means in plain words, and how to use it with the gold/silver ratio. Updated every weekday.
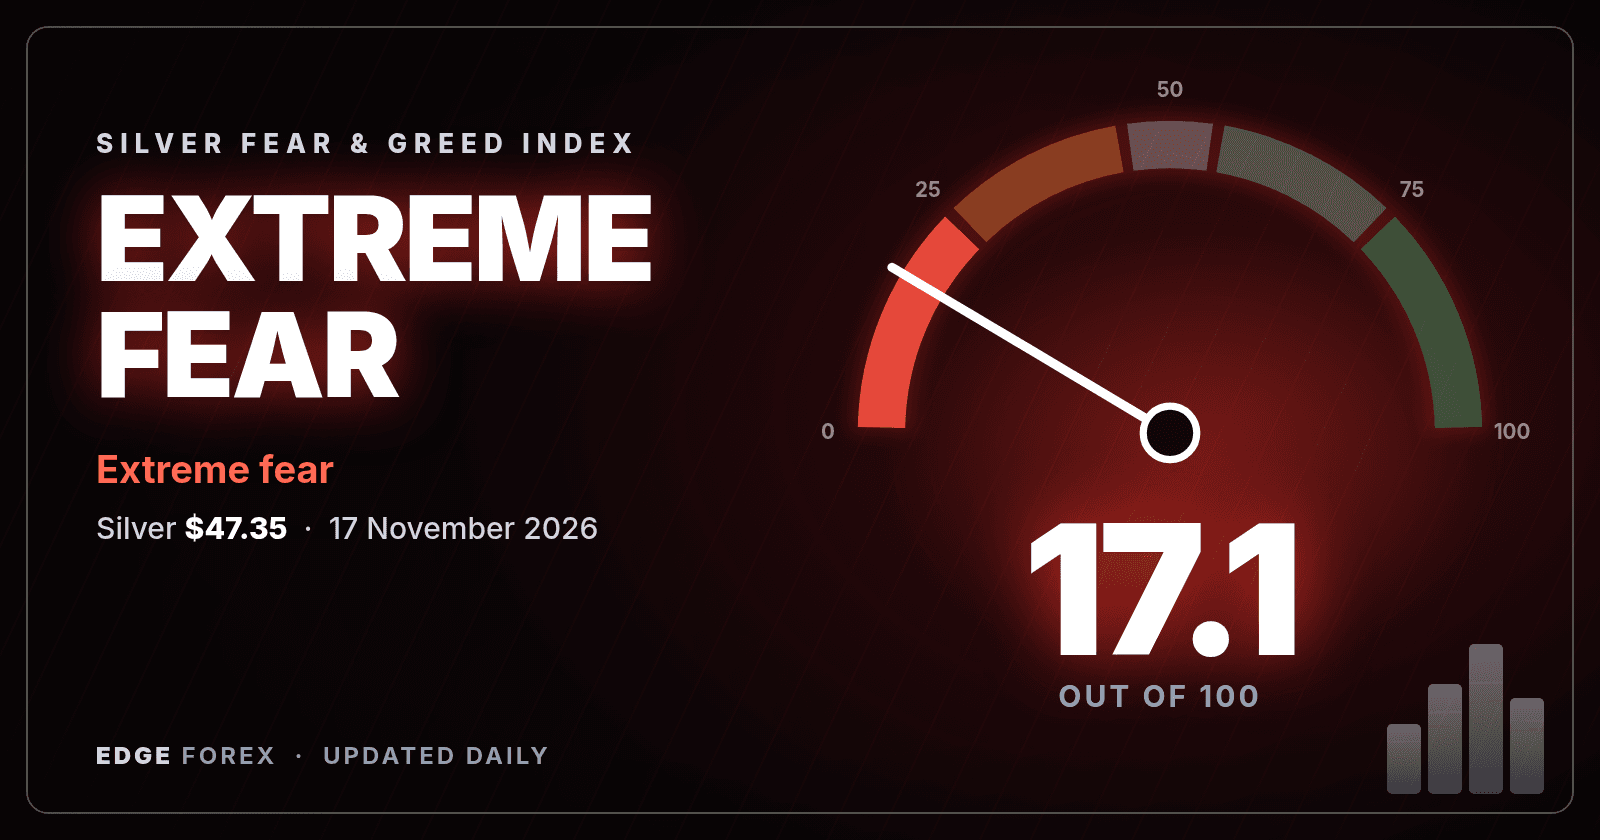
Short answer: the Silver Fear and Greed Index is a single number from 0 to 100 that shows whether silver traders are fearful (low numbers) or greedy (high numbers). The live reading, a 30-day chart and the five inputs are in the cards below, updated every weekday. Treat it as a mood gauge, not a buy or sell signal.
Silver Fear and Greed Index today
17.1 Extreme fear
Reading for 17 November 2026, with silver futures at $47.35. Up 0.5 on the previous day and down 16.5 over five trading days. 0 is extreme fear, 100 is extreme greed. Gold costs 81.7 times as much as silver (the gold/silver ratio).
| Silver volatility (VXSLV) greed side. calm markets point to greed, stress to fear | 55 |
| Price momentum fear side. silver against its 125-day average | 6 |
| Price strength (RSI) fear side. standard 14-day RSI, rescaled so 30 counts as 0 and 70 as 100 | 4 |
| US dollar fear side. a falling dollar tends to favour silver | 16 |
| Fund positioning fear side. CFTC net long of managed money in silver | 4 |
How it is built: each of the five readings is ranked against its own previous year (fund positioning against three years), scaled 0 to 100, and averaged with equal weight. Price strength is the standard 14-day RSI (Wilder), stretched so an RSI of 30 scores 0 and an RSI of 70 scores 100. The index is recalculated every day from public data: CBOE silver volatility (VXSLV), COMEX silver futures, the US dollar index and the CFTC Commitments of Traders report. It is built the same way as our gold index, so the two can be compared. It describes sentiment. It does not predict price.
Educational sentiment data, not financial advice. Updated daily.
Cite this index: Edge-Forex Gold Fear and Greed Index
Silver live: price and quotes
What is moving silver
- Silver futures fell 4.59% to $46.78 on 2026-11-16, and lost 11.0% over five sessions.
- Gold -0.9%: silver often follows gold lower.
- Copper -1.3%: factory demand worries.
- US 10-year yield -3 bp: less competition for silver.
- That close was silver's lowest in 118 sessions.
Gold/silver ratio: 82.4 (usual 69.5, previous close 79.3). The ratio is how many ounces of silver one ounce of gold buys. Silver is cheap against gold by its own history.
Next big event: FOMC MEETING MINUTES, WEDNESDAY 19:00 UTC (2:00 pm New York, 7:00 pm London, 12:30 am India).
Sources: COMEX silver and gold futures, copper futures, US 10-year yield and the US dollar index via Yahoo Finance. Educational data, not financial advice.
What the Silver Fear and Greed Index measures
The index combines five public measurements, each ranked against its own recent history and averaged with equal weight:
- Volatility: the CBOE Silver ETF Volatility Index (VXSLV). Calm markets point to greed, stress points to fear.
- Momentum: silver futures against their 125-day average.
- Price strength: the standard 14-day RSI, stretched so 30 scores 0 and 70 scores 100.
- US dollar: a falling dollar tends to favour silver, a rising one to weigh on it.
- Fund positioning: how heavily managed-money traders are net long silver, from the weekly CFTC Commitments of Traders report.
How to read the zones
- 0 to 25, extreme fear: heavy selling, high volatility and weak momentum. Markets can stay here for days, and sharp rebounds are common, but there is no guarantee.
- 25 to 45, fear: cautious mood, buyers hesitant.
- 45 to 55, neutral: no strong lean either way.
- 55 to 75, greed: buyers in control, positioning building.
- 75 to 100, extreme greed: crowded and stretched. That is when pullbacks tend to hurt most.
Silver versus gold: the gold/silver ratio
Silver is more volatile than gold and also an industrial metal, so it reacts to factory demand and copper as well as to the dollar and interest rates. The gold/silver ratio, how many ounces of silver one ounce of gold buys, helps put the mood in context. A ratio far above its long-run average means silver is cheap compared with gold, a ratio far below means it is expensive. Compare it with our gold fear and greed index, which is built the same way.
How to use it
- Check the zone and the 30-day direction, not only today's number.
- Look at which of the five inputs is pulling the score. A low score driven by positioning is a different story from one driven by volatility.
- Use it with your own plan: levels, risk per trade and the economic calendar. The index describes sentiment, it does not predict price.
Daily readings, history since 2018 and the full method are at Nuvo Silver. Get the daily silver mood as a 40-second video on the Silver Mood YouTube channel, and join the free trading chat on Telegram.
Frequently asked questions
How often is the silver index updated?
Every weekday after the COMEX close, with the live price panels updating continuously.
Does extreme fear mean silver will go up?
No. In our own testing the gold index did not reliably predict direction, and a silver mood should be treated the same way. Use it as context, not a signal.
Where does the data come from?
CBOE, COMEX futures prices from Yahoo Finance, the US dollar index and the CFTC Commitments of Traders report.
Educational sentiment data, not financial advice. Trading carries risk.
Edge-Forex publishes general market analysis, not investment advice. Market data shown is indicative and may be delayed.
Written by
Vinit Makol
Lead Strategist and Market Analyst at Edge-Forex
Vinit Makol is a forex trader, strategist and market analyst with more than 20 years of experience in forex and financial markets.
Covers