US Dollar Index Fear and Greed: Live DXY Mood Reading
Live US Dollar Index (DXY) fear and greed reading from 0 to 100, with the five inputs behind it and a plain-language guide to the dollar's mood.
Short answer: the DXY Fear and Greed Index turns the dollar's strength into one 0 to 100 number: low readings mean the dollar is being sold hard, high readings mean buyers are crowded in. The live reading, chart and inputs are in the cards below.
US Dollar Index (DXY) Fear and Greed Index today
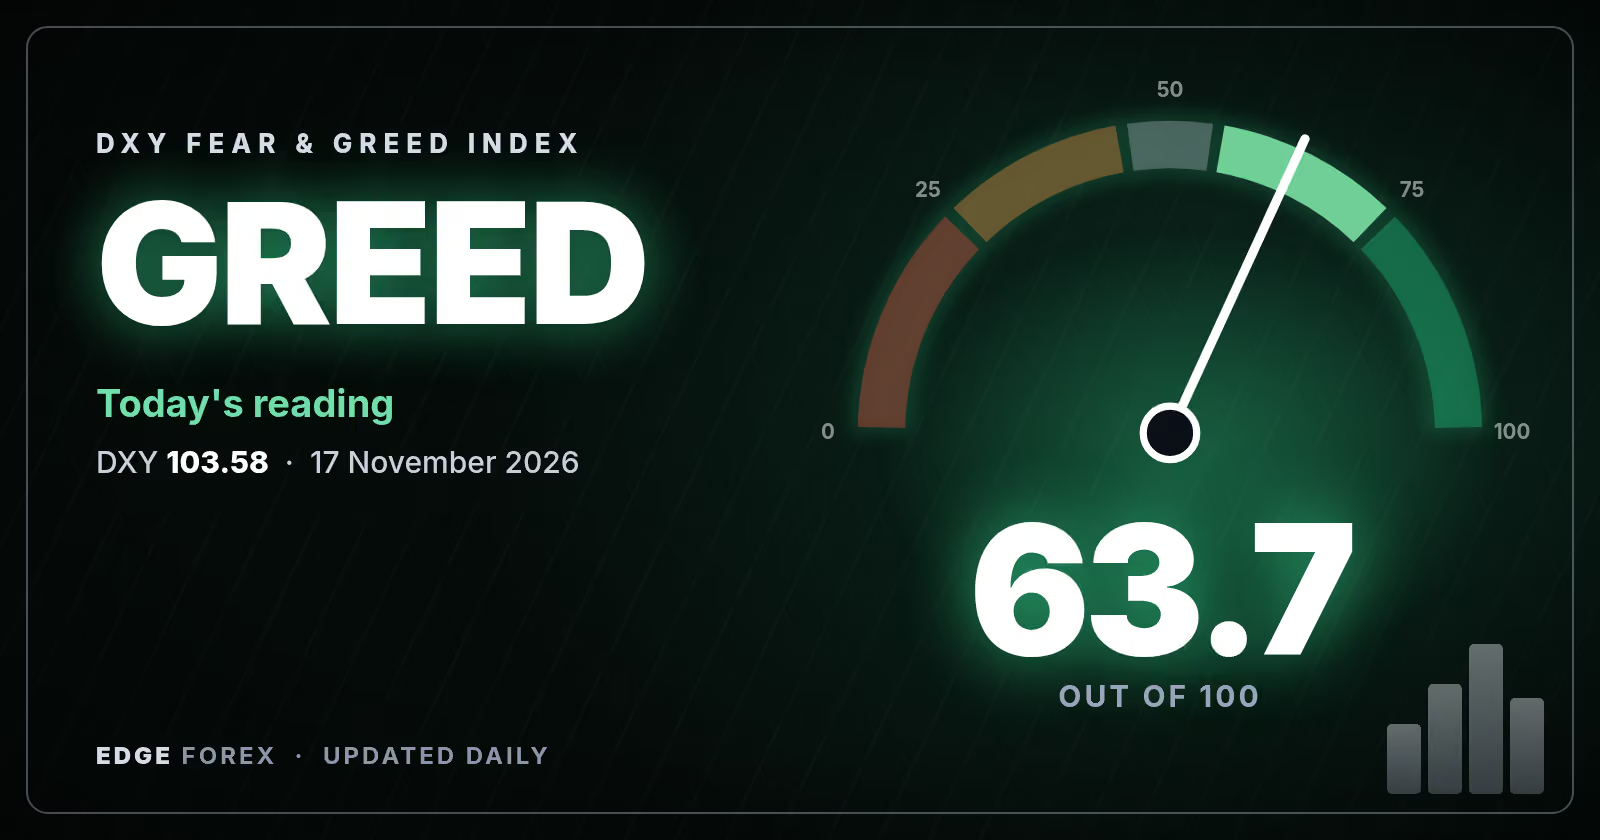
63.7 Greed
Reading for 17 November 2026, with US Dollar Index (DXY) at 103.58. Up 1.5 on the previous day and up 14.6 over five trading days. 0 is extreme fear, 100 is extreme greed.
| DXY volatility (20-day measured) fear side. calm markets point to greed, stress to fear | 28 |
| Price momentum greed side. DXY against its 125-day average | 99 |
| Price strength (RSI) greed side. standard 14-day RSI, rescaled so 30 counts as 0 and 70 as 100 | 95 |
| US 10-year yield fear side. rising US yields have tended to support the dollar | 29 |
| Fund positioning (ICE dollar index futures) greed side. net positioning of speculative funds, ranked against the last three years | 67 |
How it is built: each of the five readings is ranked against its own previous year (fund positioning against three years), scaled 0 to 100, and averaged with equal weight, the same method as our gold and silver indexes so readings can be compared across markets. The index is recalculated every day from public data: Yahoo Finance daily prices and the CFTC Commitments of Traders report. It describes sentiment. It does not predict price.
Educational sentiment data, not financial advice. Updated daily.
Cite this index: Edge-Forex US Dollar Index (DXY) Fear and Greed Index · All market moods
US Dollar Index (DXY) live: price and related markets
What is moving US Dollar Index (DXY)
- US Dollar Index (DXY) rose 0.03% on 2026-11-17 and gained 1.32% over five sessions.
- US 10-year yield rose 0.1% over 20 days; rising US yields have tended to support the dollar.
- Price momentum reads 99 out of 100, on the greed side.
- Price strength (RSI) reads 95 out of 100, on the greed side.
- Over the last 30 sessions the mood ranged from 42.7 (2026-11-09) to 85.0 (2026-10-07).
Sources: Yahoo Finance daily prices and the CFTC Commitments of Traders report. Educational data, not financial advice.
What US Dollar Index (DXY) is and why traders watch it
The US Dollar Index measures the dollar against six currencies, with the euro making up well over half of the basket, followed by the yen, pound, Canadian dollar, Swedish krona and Swiss franc. Because of that weighting, the index is really a euro-versus-dollar gauge with a few extras, which is why traders use it as the one-number summary of dollar strength before looking at individual pairs.
What moves US Dollar Index (DXY)
- Interest-rate expectations: when markets expect the Federal Reserve to keep rates higher than other central banks, the dollar tends to firm.
- Safe-haven demand: in sharp risk-off episodes money often flows into dollars and Treasuries.
- Relative growth: stronger US data than in Europe or Japan tends to lift the index.
- Euro weakness: since the euro is the biggest weight, an ECB surprise can move the whole index.
The five inputs behind the US Dollar Index (DXY) mood
- DXY volatility (20-day measured): calm markets point to greed, stress to fear.
- Price momentum: DXY against its 125-day average.
- Price strength (RSI): standard 14-day RSI, rescaled so 30 counts as 0 and 70 as 100.
- US 10-year yield: rising US yields have tended to support the dollar.
- Fund positioning (ICE dollar index futures): net positioning of speculative funds, ranked against the last three years.
How to read the US Dollar Index (DXY) mood
A very low reading means the dollar has been sold heavily, with weak momentum and fund positioning tilted against it. A very high reading means the opposite and a crowded long dollar trade. Because the index sits on the other side of nearly every major pair, a dollar mood at an extreme is the first thing to check when EUR/USD or USD/JPY looks stretched.
Unlike most instruments here, DXY has no volatility index of its own, so the volatility input uses measured price swings over the last 20 days. The yield input is the 10-year Treasury yield, the market most closely tied to the dollar's direction.
US Dollar Index (DXY) fear and greed: common questions
Is DXY the same as the dollar?
No. It is a basket of six currencies with fixed weights, so it can differ from the dollar's move against a single currency, such as the Australian dollar, which is not in it.
Why does DXY often fall when EUR/USD rises?
The euro is the largest part of the basket, so the two are close to mirror images of each other.
How is the dollar mood different from the gold mood?
Gold usually moves opposite to the dollar, but each index is built from its own inputs, so the two readings can disagree for days.
See every market on one page in the Market Mood dashboard. Daily readings for gold and silver are also at Nuvo Gold and Nuvo Silver, and the free trading chat is on Telegram.
Educational sentiment data, not financial advice. Trading carries risk.
Edge-Forex publishes general market analysis, not investment advice. Market data shown is indicative and may be delayed.
Written by
Vinit Makol
Lead Strategist and Market Analyst at Edge-Forex
Vinit Makol is a forex trader, strategist and market analyst with more than 20 years of experience in forex and financial markets.
Covers