USD/JPY Fear and Greed Index: Live Yen Mood Reading
Live USD/JPY fear and greed reading from 0 to 100, how yen positioning and US yields shape it, and how to read the extremes.
Short answer: the USD/JPY Fear and Greed Index scores from 0 to 100 how strongly buyers are pushing dollars against yen: high means a crowded long-dollar trade, low means the pair is being sold. Live reading and inputs are in the cards below.
USD/JPY Fear and Greed Index today
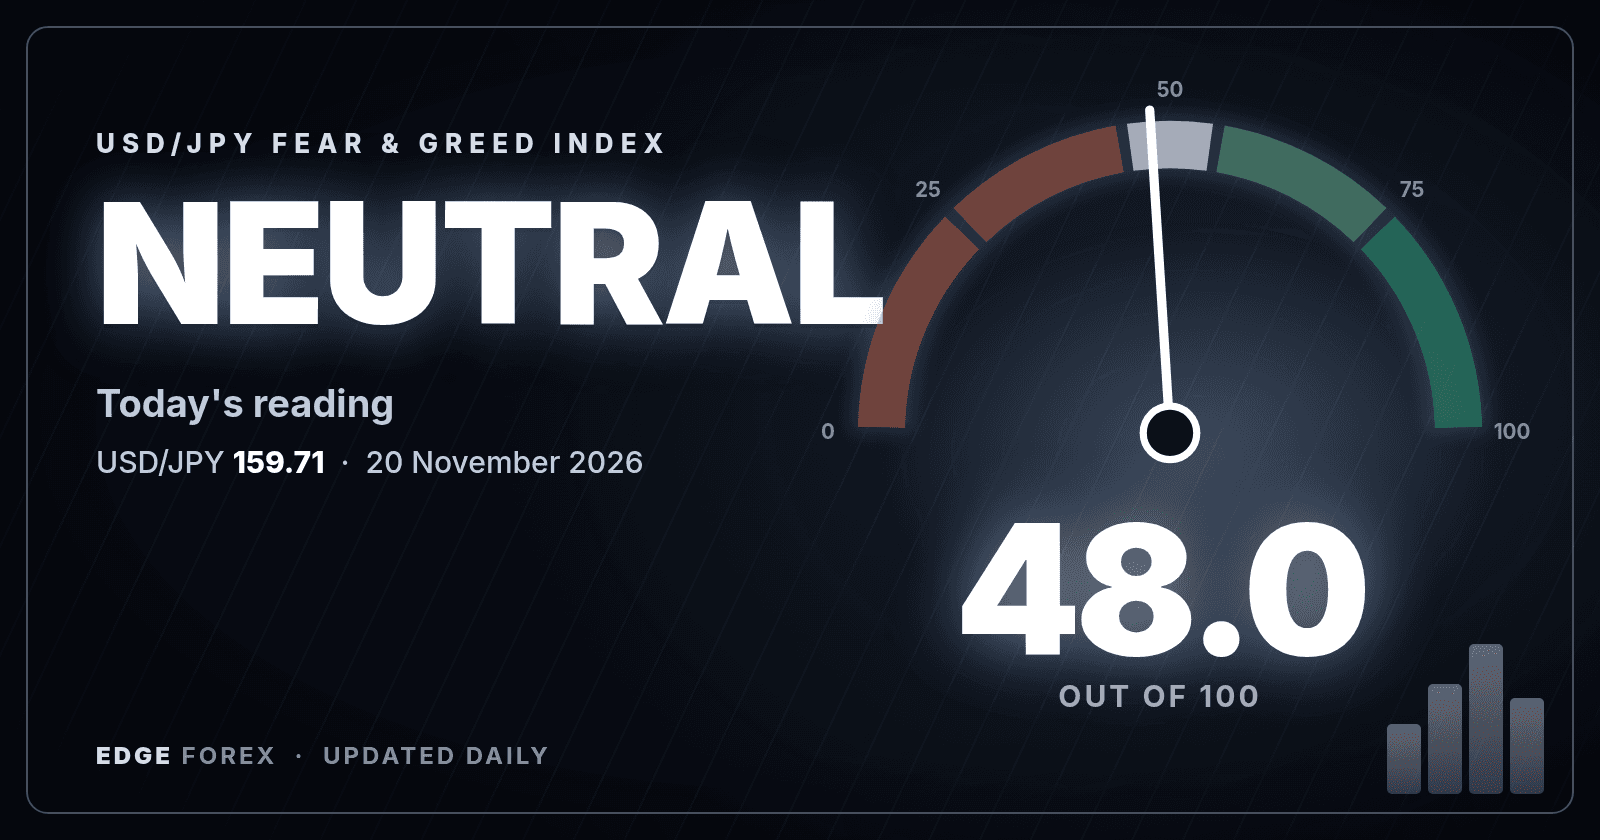
48.0 Neutral
Reading for 20 November 2026, with USD/JPY at 159.71. Up 6.4 on the previous day and down 0.8 over five trading days. 0 is extreme fear, 100 is extreme greed.
| USD/JPY volatility (20-day measured) greed side. calm markets point to greed, stress to fear | 80 |
| Price momentum fear side. USD/JPY against its 125-day average | 36 |
| Price strength (RSI) greed side. standard 14-day RSI, rescaled so 30 counts as 0 and 70 as 100 | 78 |
| US 10-year yield fear side. rising US yields have tended to push the pair higher | 22 |
| Fund positioning (CME yen futures, inverted) fear side. net positioning of speculative funds, ranked against the last three years | 24 |
How it is built: each of the five readings is ranked against its own previous year (fund positioning against three years), scaled 0 to 100, and averaged with equal weight, the same method as our gold and silver indexes so readings can be compared across markets. The index is recalculated every day from public data: Yahoo Finance daily prices and the CFTC Commitments of Traders report. It describes sentiment. It does not predict price.
Educational sentiment data, not financial advice. Updated daily.
Cite this index: Edge-Forex USD/JPY Fear and Greed Index · All market moods
USD/JPY live: price and related markets
What is moving USD/JPY
- USD/JPY rose 0.20% on 2026-11-20 and lost 0.11% over five sessions.
- US 10-year yield fell 0.8% over 20 days; rising US yields have tended to push the pair higher.
- USD/JPY volatility (20-day measured) reads 80 out of 100, on the greed side.
- Price strength (RSI) reads 78 out of 100, on the greed side.
- Over the last 30 sessions the mood ranged from 27.6 (2026-10-22) to 55.1 (2026-10-12).
Sources: Yahoo Finance daily prices and the CFTC Commitments of Traders report. Educational data, not financial advice.
What USD/JPY is and why traders watch it
USD/JPY is the price of one dollar in Japanese yen. It is the classic carry-trade pair: for years traders borrowed cheap yen to hold higher-yielding dollars, so the pair tracks the gap between US and Japanese interest rates more directly than most others.
What moves USD/JPY
- US Treasury yields: the pair has historically followed the 10-year yield closely.
- Bank of Japan policy: any hint of tighter policy or a change in yield-curve control can pull the pair down fast.
- Intervention risk: Japan's Ministry of Finance has stepped in to support the yen before, and the threat alone can cap rallies.
- Safe-haven flows: in a risk-off shock the yen often strengthens even when yields do not support it.
The five inputs behind the USD/JPY mood
- USD/JPY volatility (20-day measured): calm markets point to greed, stress to fear.
- Price momentum: USD/JPY against its 125-day average.
- Price strength (RSI): standard 14-day RSI, rescaled so 30 counts as 0 and 70 as 100.
- US 10-year yield: rising US yields have tended to push the pair higher.
- Fund positioning (CME yen futures, inverted): net positioning of speculative funds, ranked against the last three years.
How to read the USD/JPY mood
A high reading means the dollar-yen trade is crowded, which historically has made the pair vulnerable to sudden drops when carry trades unwind. A low reading means yen buyers are in control. Because a stretched USD/JPY can reverse in minutes on an official comment, extreme highs deserve more caution than extreme lows.
The positioning input is inverted: yen futures held net long by funds count as fear for USD/JPY, because a stronger yen means a lower pair. The driver input is the US 10-year yield rather than the dollar index, since yields are the pair's best-known partner.
USD/JPY fear and greed: common questions
Why is yen positioning inverted?
Yen futures rise when the yen strengthens, which pushes USD/JPY down, so a heavy net long yen position is bearish for the pair.
What happens to the pair when Japan intervenes?
Intervention has historically caused a sharp drop of several yen within hours, followed by a partial recovery, but there is no guarantee how any episode ends.
Is a high reading a sell signal?
No. It flags a crowded trade, not a timing signal.
See every market on one page in the Market Mood dashboard, or compare with US Dollar Index (DXY). Daily readings for gold and silver are also at NuvoGold and NuvoSilver, and the free trading chat is on Telegram.
Educational sentiment data, not financial advice. Trading carries risk.
Edge-Forex publishes general market analysis, not investment advice. Market data shown is indicative and may be delayed.
Written by
Vinit Makol
Lead Strategist and Market Analyst at Edge-Forex
Vinit Makol is a forex trader, strategist and market analyst with more than 20 years of experience in forex and financial markets.
Covers